Explore Jobs
Find Specific Jobs
Explore Careers
Explore Professions
Best Companies
Explore Companies
This question is about accountant demographics.
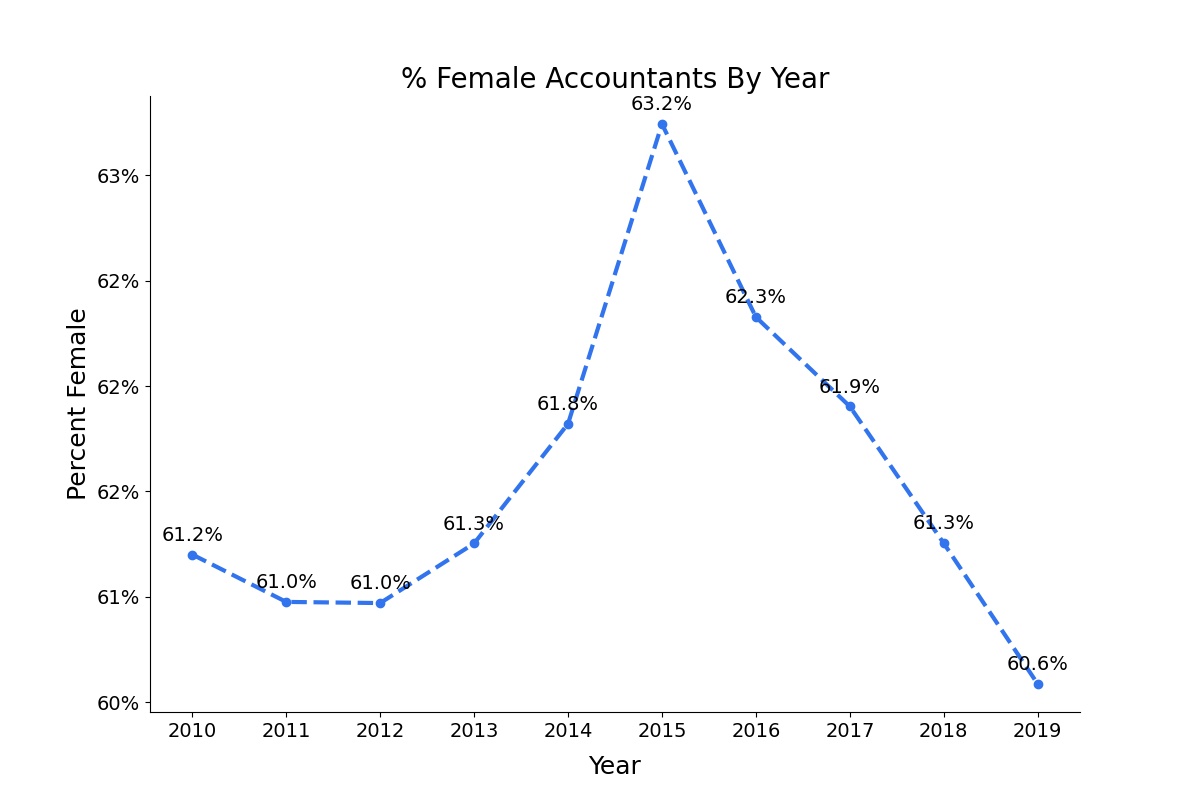
What percentage of Accountants are female?
60.6% of accountants are female in the United States. This is -0.7 percentage points lower than last year. Additionally, the percentage of female accountants has decreased by -0.6 percentage points since 2010. That means there are a total of 652,164 female accountants in the U.S. and 424,015 male accountants in the United States. Note that Zippia's estimate accounts only for the 1,076,179 people with the specific job title of accountant and doesn't include grouping similar job titles, or people with potentially similar credentialing.
Percent Of Female Accountants By Year
| Year | Female Accountants | Male Accountants | Percentage Female Accountants | Percentage Male Accountants | |
| 2019 | 7,444 | 4,843 | 60.6% | 39.4% | |
| 2018 | 8,987 | 5,684 | 61.3% | 38.7% | |
| 2017 | 9,037 | 5,562 | 61.9% | 38.1% | |
| 2016 | 8,718 | 5,270 | 62.3% | 37.7% | |
| 2015 | 8,691 | 5,051 | 63.2% | 36.8% | |
| 2014 | 8,288 | 5,118 | 61.8% | 38.2% | |
| 2013 | 8,745 | 5,532 | 61.3% | 38.7% | |
| 2012 | 8,795 | 5,630 | 61.0% | 39.0% | |
| 2011 | 8,384 | 5,366 | 61.0% | 39.0% | |
| 2010 | 8,893 | 5,638 | 61.2% | 38.8% |
Additionally, female accountants tend to be older than male accountants. The average age of a female accountant is 45.1, while the average age of a male accountant is 41.9.
While the majority of U.S. accountants are female in 2022, there are still some occupations where males dominate. For example, 75% of audit partner are male. On the other hand, some accountant jobs are dominated by females. 79% of escrow officer, for instance, are female.
Like most jobs, there's a gender pay gap among accountants. The average male accountant earns an average annual salary of $54,565, while the average female accountant earns an average annual income of $51,860, meaning female accountants make 95 cents for every dollar a man earns.
What Percentage Of Accountants Are Female FAQ
Are accountants jobs male or female dominated?
Accountant jobs are female dominated. 60.6% of accountants are female and 39.4% of accountants are male in the United States.
How has the number of female accountants changed over time?
The number of female accountants has decreased by -0.6% since 2010. In 2010, there were 61.2% female accountants and the latest data shows that there are 60.6% female accountants in the U.S.

Choose from 10+ customizable resume templates
Zippia allows you to choose from different easy-to-use templates, and provides you with expert advice. Using the templates, you can rest assured that the structure and format of your resume is top notch. Choose a template with the colors, fonts & text sizes that are appropriate for your industry.


