- Workplace Statistics
- Time Management Statistics
- Employee Wellness Statistics
- Employment Discrimination Statistics
- Employee Recognition Statistics
- Employee Referral Statistics
- Workplace Violence Statistics
- Gamification Statistics
- Employee Feedback Statistics
- Agile Statistics
- Productivity Statistics
- Meeting Statistics
- Cell Phones At Work Statistics
- Social Media At Work Statistics
- Workplace Injury Statistics
- Workplace Stress Statistics
- Leadership Statistics
- Workplace Collaboration Statistics
- Job Satisfaction Statistics
- Paid Holiday Statistics
- Communication In The Workplace Statistics
- Wasting Time At Work Statistics
- 4-day Workweek Statistics
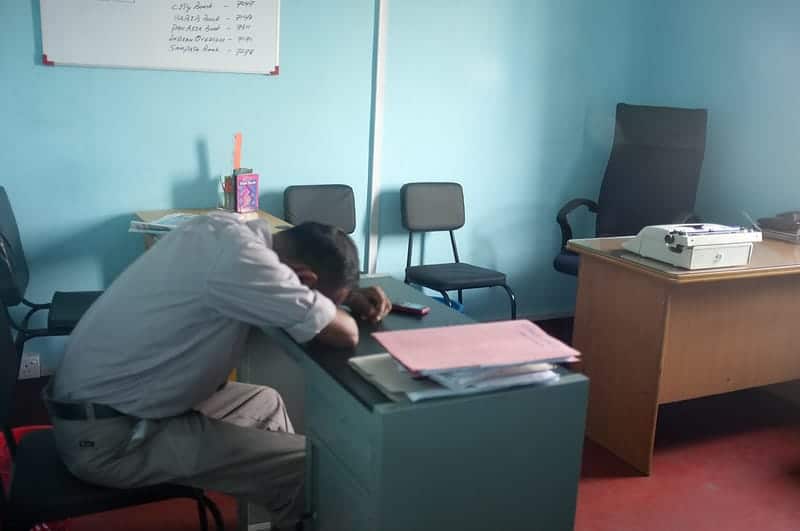
Research Summary. In recent years, workplace safety initiatives and regulations have been implemented in nearly every industry across the United States. Still, some illnesses and injuries, both nonfatal and fatal, continue to occur at job sites in the U.S. After extensive research, our data analysis team concluded:
-
There are about 2.6 million nonfatal workplace accidents and injuries in the United States’ private industry each year.
-
Sprains, strains, and tares are the most common workplace injury in the US, with 266,530 occurring in 2020.
-
Overexertion and bodily reaction, slips, trips, and falls, and contact with objects and equipment are the highest causes of workplace injury in the US, accounting for 84% of all nonfatal injuries at work.
-
Nursing assistants have the highest chance of injury, with 370 injuries per every 10,000 full-time workers.
-
There were 5,190 fatal occupational injuries in the U.S. in 2021.
-
The agriculture, forestry, fishing, and hunting industry has the highest number of on-the-job fatalities, with 23.4 fatalities per 100,000 employees.
-
Workplace injuries and illnesses cost the US an estimated $250 billion each year.
For further analysis, we broke down the data in the following ways:
Industry | Top Causes | Trends | Demographic
Workplace Injury General Statistics
-
On average, 2.8 out of 100 workers in the U.S are injured in workplace accidents every year.
With 2.6 million nonfatal workplace accidents and injuries occurring yearly across the nation’s private employment industry, about 2.8 people out of 100 get injured at work, according to the U.S. Bureau of Labor Statistics. This number, recorded in 2019, is the same rate reported in both 2018 and 2017.
-
OSHA has a 2022 budget of $591,787,000.
The federal agency’s budget increased by 10 million since 2020 when their yearly budget stood at $581,787,000. OSHA’s annual budget in 2019 was valued at $557,787,000.
-
Between OSHA’s federal branch and its state partners, there are 1,850 OSHA inspectors responsible for the safety of 130 million American workers.
Although Federal OSHA has only ten regional offices and 85 local offices, the organization’s state partners have more than 8 million total worksites across the nation. With 1,850 federal and state OSHA inspectors, there is approximately one inspector for every 70,000 U.S. workers.
In 2019, OSHA conducted 33,393 federal inspections and 42,063 state inspections.
Workplace Injury by Industry Statistics
-
15% of workplace injuries in America occur in manufacturing jobs.
According to BLS data, among private industries in the United States, manufacturing jobs have the highest rate of workplace injuries. In 2019, manufacturing worksites recorded 3.3 cases of reportable non-fatal injuries or illnesses per every 100 employees, amounting to 421,400 people who either got hurt or got sick at work.
Of the 421,400 employees involved in workplace accidents, 64,640 of them missed at least one day of work due to the injury or illness sustained on shift. 28%, or 32,470, of those who missed work, sustained a sprain, strain, or tare, while 14.5%, or 16,790, had soreness or pain, and 13.3%, or 15,380, had a cut, laceration, or puncture.
-
By industry, construction has some of the highest on-the-job fatality rates in the United States.
Data published by OSHA, or the Occupational Safety and Health Administration, shows that in 2019 20% of employee fatalities in the private industry occurred on construction sites. According to the federal report, 1,061 construction workers died in 2019, accounting for one in every five worker deaths in the U.S. that year.
5,190 U.S. workers died on the job in 2021. When broken down, there were about 15 workplace deaths per day across the nation. Thus, approximately three construction workers died on the job every day of the year.
-
Line cooks have the highest risk of falling ill with COVID-19 while on the job.
According to a recent study from the University of California, San Francisco, when it comes to contracting COVID-19 at work, line cooks are the most at risk. In addition to contracting the contagious virus, line cooks also have the highest risk of dying during the pandemic from an illness contracted on the job site.
The study found that line cooks had a 60% increase in mortality during the height of the pandemic. The global pandemic also pushed mortality rates above 50% for cooks, line workers in warehouses, agricultural workers, bakers, and construction laborers.
-
79,660 people were injured at construction sites in 2019.
According to data published by the U.S. Bureau Of Labor Statistics, almost 9% of workplace injuries in 2019 occurred at construction sites, resulting in 21,170 sprains, strains, and tears, 13,190 fractures, and 10,950 cuts, lacerations, and punctures.
-
Men’s workplace injury rates are 7% higher in the private sector than male employees working in government positions.
According to BLS data, of all the workplace injuries that occurred in the private sector in 2019, 60% of cases were male, and 40% were female. When looking at government employees injured on the job during the same period, however, 53% of injuries were sustained by men while 47% were sustained by women.
Top Causes of Workplace Injuries
-
Faulty fall protection, respiratory protection, and ladders are among the top three most commonly violated OSHA standards.
Although some of the top 10 most frequently violated OSHA standards in 2021 were specific to the construction industry — like standards surrounding ladder safety, scaffolding requirements, and fall protection on construction sites — most were observed in general industries.
The top general industry violations cited by OSHA in 2021 included lack of respiratory protection, poor hazard communication, improper control of hazardous energy, hazards related to powered industrial trucks and machinery and machine guarding, and lack of training on fall protection measures.
-
In the United States, 84% of all nonfatal injuries resulting in time away from work are caused by overexertion and bodily reaction, slips, trips, falls, and contact with objects and equipment.
Instances involving excessive physical activity — like strenuous heavy lifting, pushing and straining repetitive motions — as well as slips, trips, and equipment accidents account for the majority of nonfatal workplace injuries across the country.
Data shows that the injury rate per every 10,000 full-time workers is 27 for overexertion and bodily reaction, 23.9 for falls, slips, and trips, and 22.4 for contact with objects and equipment.
Employees aged 45 to 55 are most susceptible to injuries caused by overexertion, bodily reaction, falls, slips, and trips, while people aged 16 to 24 are most at risk for injuries from contact with objects and equipment.
-
In 2019, approximately 27.4% of nonfatal workplace injuries that occurred in the private industry were due to slips, trips, and falls.
According to the U.S. Bureau of Labor Statistics, of the 888,220 workplace injuries that were recorded in 2019 that resulted in time away from work, 244,000 were from falls, slips, and trips, resulting in 75,420 sprains, strains, and tears, 46,800 fractures, and 6,740 cuts, lacerations, and punctures.
-
Of the three most common causes of workplace injury in the U.S., overexertion and bodily reaction and falls, slips, and trips result in the longest time away from work.
The number one and number two leading causes of workplace injury across the country — overexertion and bodily reaction and falls, slips, and trips — typically result in 13 days away from work.
This is compared to the country’s third leading cause of workplace injury — contact with objects and equipment — which usually results in 5 days away from work.
Workplace Injury Trends
-
Workplace deaths in the United States are down by more than 60%.
According to OSHA, workplace deaths across the country were down by 60.53% in 2019, compared to 1970. In just about 50 years, the nation’s on-the-job fatalities, on average across all industries, dropped from 38 per day in 1970 to 15 per day in 2019.
-
The U.S. workplace injury and illness rate has dropped by about 74% in a 47-year period.
Data released by the United States Occupational Safety and Health Administration shows that workers were getting hurt or sick on the job 74.3% less often in 2019 than they were in 1972.
According to research, there were approximately 10.9 incidents per every 100 workers in 1972. In 2019, there were roughly 2.8 incidents per every 100 workers.
Workplace Injury Demographic Statistics
-
On average, men are injured on the job 17.3% more often than women.
According to BLS data, in the private industry, 91.7 out of 10,000 full-time male employees sustained injuries that resulted in time away from work in 2019, compared to just 80.4 out of 10,000 full-time female employees, thus making men 17.3% more likely to get injured at work.
The injury rates for both men and women decreased, however, between 2018 and 2019. In 2018, 94.3 men and 83.4 women per 10,000 full-time employees sustained on-the-job injuries.
-
When workplace injuries occur, people 65 years of age and older typically stay home from work for double the amount of time than the national average.
While people in the United States miss, on average, eight days of work after being injured or involved in an accident at work, employees 65 years and older stay home from work, on average, for 16 days due to workplace injuries and illnesses.
-
21.3% of people who missed work because of on-the-job injuries in 2019 were between 25 and 34 years old.
According to data released by the U.S. Bureau of Labor Statistics, of the 888,220 people who were injured at work and missed at least one day of work because of that injury, 189,310 of them were between 25 and 34 years old and 184,850, or 20.8%, were between 45 and 54 years old.
Employees aged 14 to 15 had the least injuries, followed by those 16 to 19 years old, those 65 and older, and those 20 to 24 years old.
-
In 2019, California and Texas had the highest number of workplace deaths compared to any other state in the country.
According to labor statistics, 488 people died while working in Texas in 2019, and 422 people died while working in California in 2019. Although the fatality rates were high in both states, California recorded an incident rate of 2.3 per 100,000 full-time employees, and Texas recorded an incident rate of 3.8 per 100,000 full-time employees.
Other states with higher than average fatal workplace incident rates included Wyoming, Alaska, North Dakota, West Virginia, South Dakota, and Mississippi, with incident rates of 11.5, 9.9, 9.6, 7.9, 6.9, and 6.7 per 100,000 full-time workers.
-
Arkansas, Delaware, and Georgia are considered the top three least dangerous states, with workplace injury rates below the national average.
Other states with nonfatal workplace illness and injury rates below the national average of 2.8% include Louisiana, Massachusetts, New Jersey, New York, North Carolina, Ohio, South Carolina, Texas, and Virginia.
Alabama, Illinois, Maryland, Missouri, New Mexico, Tennessee, and Utah have workplace injury rates similar to the national average.
-
On average, people injured on the job miss eight days of work.
In the private industry in 2019, the median number of days people spent away from work due to an on-the-job accident or injury was eight. Some industries, however, recorded higher than average time away from work because of workplace injuries.
For instance, workplace injuries in 2019 caused heavy and tractor-trailer truck drivers to miss an average of 19 days of work, light truck drivers to miss an average of 20 days of work, and material movers and maintenance, repair, freight, and stock workers to miss an average of 12 days of work.
-
Less than half of all employees injured on the job in 2019 missed work because of their workplace injury or illness.
According to the Department of Labor, of the 2.8 million workers injured in 2019, only 888,220 of them missed at least one day of work because of their injury or illness. The data showed that .9 people per every 100 workers in the U.S.’s private industry sustained a workplace injury that caused them to miss at least one day of work.
Workplace Injury FAQ
-
What is workers’ comp?
Workers’ compensation, or workers’ comp for short, is a type of social insurance available to employees who are injured or become ill while at work. Workers’ comp provides state-mandated medical coverage and wage benefits to laborers who sustain on-the-job injuries or illnesses.
In addition to providing employees with compensation for medical expenses and lost wages, workers’ comp also typically protects businesses from civil lawsuits.
-
OSHA stands for the Occupational Safety and Health Administration. It’s a federal branch of the United States Department of Labor that sets and enforces safety standards to foster healthy, safe, and efficient workplaces across the nation.
OSHA was established from the Occupational Safety and Health Act passed by congress in 1970 and now covers most private sector employers and employees and many public sector employers and employees across the 50 states and in certain U.S. territories and jurisdictions.
-
What is the number 1 cause of death in the workplace?
The number one cause of death in the workplace is falling, which accounts for 36.5% of all deaths. This can include falling off buildings, poles, ladders, construction areas, or downstairs, and partially explains why construction and other related fields are so dangerous.
Additionally, if falling yourself doesn’t kill you in the workplace, falling objects just might. In the US 10.1% of deaths occur due to swinging, falling, or misplaced objects.
-
What is the most frequently cited OSHA standards violation?
Fall Protection, construction is the most frequently cited standards violation by federal OSHA for all industries. Respiratory Protection, general industry is next, followed by Ladders, construction. OSHA publishes this list to help alert employers about these cited standards so they are able to take the necessary steps to precent it from happening.
-
What is the most common workplace injury?
The most common workplace injury are slips and falls. When a person falls they can hit their head or break a bone. In fact, 84% of all nonfatal injuries resulting in time away from work are caused by slips, trips, falls, overexertion and bodily reaction, and contact with objects and equipment.
Conclusion
While workplaces across the country have instituted new safety guidelines and regulations in recent years to significantly curb workplace injuries by more than 60% since 1970, accidents, both major and minor, do continue to occur at reduced rates in the United States.
With 2.6 million nonfatal workplace injuries and illnesses, and 5,190 workplace fatalities, annually, workplace incidents cost the U.S. an estimated $250 billion each year.
Although incidents can occur in any industry, agriculture, forestry, fishing, hunting, transportation and warehousing, and construction continues to rank among the most dangerous industries in the country.
References
-
United States Department Of Labor. “OSHA Data Statistics: Commonly Used Statistics.” Accessed on 8/14/2021.
-
U.S. Bureau Of Labor Statistics. “News Release: Employer Reported Workplace Injuries And Illnesses — 2021.” Accessed on 8/15/2021.
-
National Safety Council. “Top Work-Related Injury Causes.” Accessed on 8/16/2021.
-
U.S. Bureau Of Labor Statistics. “Number Of Nonfatal Occupational Injuries And Illnesses Involving Days Away From Work By Event Of Exposure Leading To Injury Or Illness And Selected Natures Of Injury Or Illness, Private Industry, 2019.” Accessed on 8/16/2021.
-
U.S. Bureau Of Labor Statistics. “Number Of Nonfatal Occupational Injuries And Illnesses Involving Days Away From Work By Industry And Selected Natures Of Injury Or Illness, Private Industry, 2019.” Accessed on 8/16/2021.
-
Work Injury Source. “Workplace Injury Statistics — 2021 UPDATE: Data For Workplace Accidents, Injuries, And Deaths.” Accessed on 8/16/2021.
-
CNBC. “Line Cooks Have The Highest Risk Of Dying During Pandemic, Plus Other Riskiest Jobs: Study.” Accessed on 8/16/2021.
-
U.S. Bureau Of Labor Statistics. “Injuries, Illnesses, and Fatalities.” Accessed on 4/3/2023.
-
United States Department Of Labor. “The 10 Most Frequently Cited Standards.” Accessed on 4/3/2023.
-
MercyCare. “Common Workplace Injuries & How To Prevent Them.” Accessed on 4/3/2023.
-
U.S. Bureau of Labor Statistics. “Census of Fatal Occupational Injuries Summary, 2021.” Accessed in 4/3/2023.
- Workplace Statistics
- Time Management Statistics
- Employee Wellness Statistics
- Employment Discrimination Statistics
- Employee Recognition Statistics
- Employee Referral Statistics
- Workplace Violence Statistics
- Gamification Statistics
- Employee Feedback Statistics
- Agile Statistics
- Productivity Statistics
- Meeting Statistics
- Cell Phones At Work Statistics
- Social Media At Work Statistics
- Workplace Injury Statistics
- Workplace Stress Statistics
- Leadership Statistics
- Workplace Collaboration Statistics
- Job Satisfaction Statistics
- Paid Holiday Statistics
- Communication In The Workplace Statistics
- Wasting Time At Work Statistics
- 4-day Workweek Statistics
Author
Elsie is an experienced writer, reporter, and content creator. As a leader in her field, Elsie is best known for her work as a Reporter for The Southampton Press, but she can also be credited with contributions to Long Island Pulse Magazine and Hamptons Online. She holds a Bachelor of Arts degree in journalism from Stony Brook University and currently resides in Franklin, Tennessee.