- Business Statistics
- Startup Statistics
- Cloud Adoption Statistics
- Customer Loyalty Statistics
- Nonprofit Statistics
- Affiliate Marketing Statistics
- Cart Abandonment Rate Statistics
- Ridesharing Statistics
- Call Center Statistics
- eLearning statistics
- Customer Service Statistics
- Customer Experience statistics
- Entrepreneur Statistics
- Outsourcing Statistics
- Gross Revenue for Marketing and Advertising
- Sales Statistics
- MBA Statistics
- Average Small Business Revenue + Profit Margin
- How Much Do Employee Benefits Cost?
Research Summary. Nothing says “living the American Dream” like creating a successful startup. While startups can be full of risks and expenses, they’re also incredibly rewarding when successful.
Of course, as exciting as kicking off a startup might be, the process comes with a whole host of challenges. From a lack of capital to low survival rates, it’s important to understand how startups really work. For that reason, we’ve gathered an extensive list of essential startup statistics, so you can know exactly what you’re getting yourself into. According to our extensive research:
-
The US is home to over 72,500 startups as of 2022.
-
Startups only have a 50% five-year survival rate.
-
There are over 1,200 billion-dollar startups (unicorns) around the world.
-
70% of startups fail due to premature scaling.
Startup Statistics by Survival Rate
Investing in a startup is risky by nature, in part, due to undeniably high failure rates. To find out more about startup survival and failure, here are some key statistics:
-
Approximately 10% of startups fail within their first year.
Many who create startups are deceived by the high 90% survival rate that can be expected within the first year. Initial success can lead to premature scaling and general overspending, which ultimately brings the startup down in future years.
-
Up to 70% of startups fail between two to five years.
After the first year, survival rates for startups begin to drop off significantly. Many startups will start with a large sum of initial capital, which can become a dwindling resource by the second year in business. For this reason and many others, many startups start to struggle by the second year.
-
Up to 90% of startups fail by year 15.
The average number of US businesses that are still in operation by year 15 is 25%, but as many as 9/10 startups can fail in the tenth year.
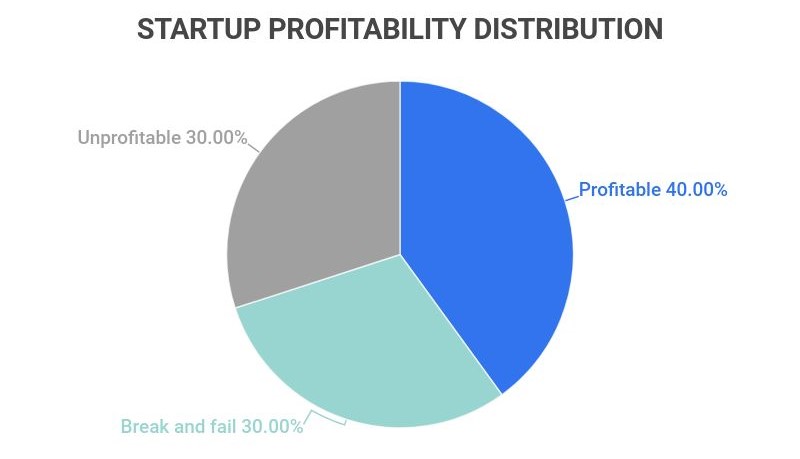
Startup Statistics by Profitability
Profitability is essential for startups but not always achieved. Many businesses overspend, fall behind on marketing, and face a whole host of other financial issues. Here are the facts:
-
Only 40% of startups are profitable.
With the other 60% split evenly between the 30% who aren’t profitable and the 30% who break and fail.
Profitability Share of startups Profitable 40% Not profitable 30% Break and fail 30% -
The global startup economy has a market cap of over $3 trillion.
The global startup economy is massive, in part because startups tend to be fast, young companies. Even if profitable startups are uncommon, they can be highly lucrative.
-
A new startup only has a 0.00006% of becoming a unicorn.
While this increases to a 2.5% (one in 40) chance for venture-backed seed-stage startups, becoming a unicorn is still incredibly unlikely.
-
64% of the top 100 unicorns aren’t profitable.
As it turns out, being worth at least $1 billion doesn’t equate to profitability. Unicorns are no more profitable than smaller startups but rather have far more investors.
Startup Statistics by Funding
Typically in the form of venture capital and investors, funding is essential for any successful startup. However, that doesn’t mean every startup receives the funding they need. To find out more, here are some key facts:
-
Only 0.05% of startups raise venture capital
25% of startups that raise venture capital are successful in the long term, compared to only 10% of those who don’t. Despite this, the vast majority of startups never gain funding this way.
-
One in three startups starts with less than $5,000 in capital.
Even though the average small business requires at least $10,000 in startup capital, a considerable 33% start with less than half of that.
-
50% of startups start from home.
Of the 32.5 million small businesses in the US, a whopping 19 million are home-based. This is no different for any type of startup, where half start at home.
Startup Statistics by Reasons for Failure
The 90% of startups that fail do so for a variety of reasons. From failing products to marketing errors, here are some essential facts about startup failures:
-
Founders of failed startups are 20% more likely to succeed on a second attempt.
If at first, you don’t succeed, try launching a new startup. As it turns out, the mistakes many entrepreneurs learn from their first startup can make their second far more likely to be successful. Of course, this also highlights the need for wealth and capital when trying to create a successful startup.
-
42% of startups fail due to long development times.
Long development times are costly because the product or innovation will continue to suck more resources out of the startup’s capital without yet offering anything in return.
-
34% of startups fail because of a lack of product-market fit.
Lacking a product-market fit is one of the biggest reasons why startups fail, but there are many other common reasons as well. These include: marketing problems (22%), team problems (18%), financial problems (16%), and more.
Reason for failing Share of startups Lack of product-market fit 34% Marketing problems 22% Team problems 18% Financial problems 16% Tech, operations, or legal problems 10%
Startup Statistics by Country
Though the United States is a popular location for many startups, it certainly isn’t the only one. And though the US still reigns supreme in 2023, many other countries are seeing an increasing interest in startups as well. Here are the facts:
-
The US has more than 4x (times) the number of startups than the next runner-up country.
India has the second-highest number of startups in the world, at 13,905. However, this still pales in comparison to the United States’ 72,560. In fact, the US has just about double the number of startups as all nine of the other top ten countries combined.
Country Number of startups (2022) United States 72,560 India 13,905 United Kingdom 6,396 Canada 3,446 Australia 2,399 Indonesia 2,391 Germany 2,320 France 1,579 Spain 1,411 Brazil 1,165 -
San Fransisco is the #1 city for startups, with a quality score of 550.27.
When measuring cities based on quantity, quality, and business environment for startups, San Fransisco scores more than double the number of points when compared to the next runner-up: New York.
City Total score San Fransisco 550.27 New York 217.00 London 125.64 Lost Angeles 113.86 Boston 108.05 Bejing 102.70 Shanghai 70.62 Banglore 63.28 Tel Aviv 54.89 Paris 52.88 -
The United States is home to 64.7% of all Unicorns.
The US is home to the vast majority of startups that are worth $1 billion or more. Others among the top five countries include: China (13.8%), India (4.1%), the United Kingdom (2.5%), and Singapore (2.2%).
Country Share of unicorns United States 64.7% China 13.8% India 4.1% United Kingdom 4.1% Singapore 2.2% Sweden 2.1% Germany 2.0% Canada 1.6% South Korea 1.5% Russia 1.0% -
China’s ByteDance is currently the most valuable unicorn, worth $140 billion.
This AI-based startup is worth more than any other in the world as of 2023, with other significant unicorns including Space X ($127 billion), SHEIN ($100 billion), Stripe ($95 billion), and Canva ($40 billion).
Unicorn Valuation Country of origin ByteDance $140B China SpaceX $127B United States SHEIN $100B China Stripe $95B United States Canva $40B Australia Checkout.com $40B United Kingdom Instacart $39B United States Databricks $38B United States Revolut $33B United Kingdom Epic Games $31B United States
Startup Statistics FAQ
-
What percentage of startups are successful?
Only 10% of startups are successful long-term. Initial success can be deceiving for many startups, as 90% survive their first year. However, this high rate drops off drastically by the fifth year, when only half of the startups that had started years prior remain.
Specifically, startups run into the hottest water between the second and fifth year, when up to 70% are left in the dust between that time frame.
-
How many startups were created in 2022?
5,779 startups were created in the US in 2022. The number of startups in the US has been increasing steadily year over year. As of 2022, there are over 72,500 startups across the country.
To put that in perspective, more startups were created in the US in 2022 than there are in total between Australia and Indonesia (the countries with the 4th and 5th highest number of total startups).
-
What is a realistic growth rate for a startup?
A realistic growth rate for a startup is between 15% and 45%. However, companies that make $2 million or more can have much higher growth rates, up to 178% in their first year, 100% for the second, and 71% for the third.
Seeing growth can often trick entrepreneurs into believing they need to upscale and quickly. This often results in premature scaling, which kills 70% of startups.
-
What percentage of startups get acquired?
16% of Series E startups are acquired. Startups don’t usually start getting acquired until Series E, and at that point, less than 20% of startups remain. Any startup below a Series E is far more likely to fail than to ever be acquired.
-
What is the biggest reason that startups fail?
Premature scaling is the biggest reason why startups fail, being responsible for 70% of failures. However, there are ultimately many reasons why startups fail, and some of the most common include:
A lack of product-market fit (34%), marketing problems (22%), team problems (18%), financial problems (16%), and more.
Ultimately, startups are far more likely to fail than to succeed, which is why it’s important to monitor a startup very carefully, even if it’s initially successful.
Conclusion
Creating a successful startup, or even a unicorn, is the dream of many entrepreneurs. Being the one to pioneer new ideas, products and innovations is incredibly rewarding and exemplifies the American spirit.
However, this dream also comes with the reality of high risk and shocking failure rates. The fact is that 90% of startups fail in the long term, and a multitude of issues can arise in less than five years.
Ultimately though, you shouldn’t let these statistics scare you. Instead, use them to your advantage to understand the market and plan your startup effectively. After all, the lessons entrepreneurs learn from their first startup lead them to be 20% more successful when starting their second.
So continue to dream, and make your dreams come true through determination, willpower, and copious amounts of research.
References
-
Failory – Startup Failure Rate: How Many Startups Fail and Why in 2023?
-
Embroker – Checklist: How to Become a Unicorn Startup in 2023
-
TechCrunch – Unicorns aren’t profitable, and Wall Street doesn’t care
-
Small Business Trends – One-third of Small Businesses Start with Less Than $5,000
-
Forbes – 11 Surprising And Insightful Statistics About Startups
-
Statista – Leading cities for startups worldwide in 2022, by total score
- Business Statistics
- Startup Statistics
- Cloud Adoption Statistics
- Customer Loyalty Statistics
- Nonprofit Statistics
- Affiliate Marketing Statistics
- Cart Abandonment Rate Statistics
- Ridesharing Statistics
- Call Center Statistics
- eLearning statistics
- Customer Service Statistics
- Customer Experience statistics
- Entrepreneur Statistics
- Outsourcing Statistics
- Gross Revenue for Marketing and Advertising
- Sales Statistics
- MBA Statistics
- Average Small Business Revenue + Profit Margin
- How Much Do Employee Benefits Cost?
Author
Jack Flynn is a writer for Zippia. In his professional career he’s written over 100 research papers, articles and blog posts. Some of his most popular published works include his writing about economic terms and research into job classifications. Jack received his BS from Hampshire College.