- Facts and Figures
- Social Security Statistics
- Social Media Statistics
- Cell Phone Usage Statistics
- Cryptocurrency Statistics
- White Collar Crime Statistics
- Crowdfunding Statistics
- Branding Statistics
- How Many Emails Are Sent Per Day
- Money Laundering Statistics
- Childcare Availability Statistics
- Cold Calling Statistics
- Automation And Job Loss Statistics
- Student Loan Statistics
- Spam Statistics
- Password Statistics
- Ransomware Statistics
- Christmas Spending Statistics
- Average Grocery Cost By State
- Average Screen Time Statistics
- Average Monthly Expenses
- IoT Statistics
- Gen Z Statistics
Research Summary. There’s nothing more annoying than spam and not the meat variety. Often, it feels like we’re just flooded with junk emails while trying to await an important message or that the company that keeps calling us won’t take no for an answer.
Unfortunately, dealing with spam is a common and regular occurrence for many people. And as much as we all wish it would stop, the messages are simply unrelenting. To find out more, we’ve gathered the essential facts about spam. According to our extensive research:
-
Approximately 45% of all emails are spam.
-
An estimated 145 billion spam emails were sent and received daily in 2021.
-
Ads account for 36% of all spam emails.
-
46% of Americans receive spam calls on their cell phone.
General Spam Statistics
Spam is a daily nuisance for people and businesses in the US and all over the world. To understand just how prevalent and far-reaching spam is, here are some general statistics:
-
Spam costs businesses an average of $70 billion in losses per year.
Spam causes massive losses in productivity. In fact, email spam alone costs businesses an estimated $20.5 billion annually just on its own.
-
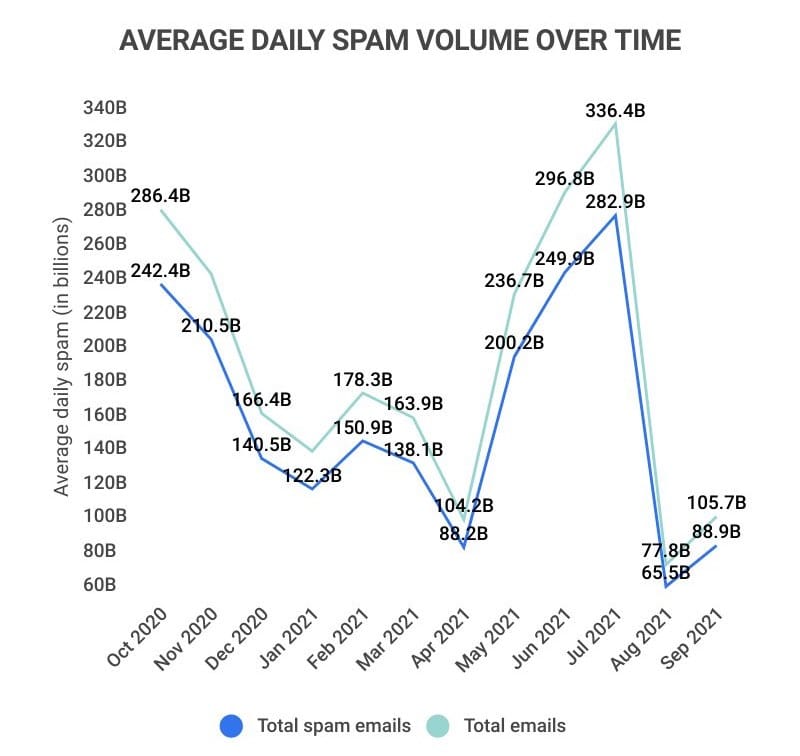
Between July 2021 and August 2021, the global daily volume of spam emails decreased by 76.8%.
The volume of global daily spam emails peaked in July 2021, reaching a whopping 282.93 billion. However, by the next month, that number dropped sharply to 65.5 billion. By September of 2021, however, the daily volume of spam emails once again began to increase to 88.88 billion (35.7% increase).
Month Daily volume of spam emails (in billions) Percent increase / decrease in spam emails Oct 2020 242.42B N/A Nov 2020 210.54B -13.15% Dec 2020 140.56B -33.24% Jan 2021 122.33B -12.97% Feb 2021 150.93B 23.38% Mar 2021 138.09B -8.51% Apr 2021 88.21B -36.12% May 2021 200.24B 127.00% Jun 2021 249.95B 24.82% Jul 2021 282.93B 13.20% Aug 2021 65.50B -76.85% Sep 2021 88.88B 35.69% -
The US is the #1 source of spam, responsible for 25.35% of all spam in the world.
The US alone accounts for over a quarter of all spam in the world, but other perpetrators include: the Russian Federation (19.84%), Germany (7.36%), the Netherlands 4.53%), and France (4.00%). However, the US and Russia alone still account for nearly half of all spam.
Country Traffic (Jan 2022 – Nov 2022) Share of spam United States 109.14M 25.35% Russian Federation 85.40M 19.84% Germany 31.70M 7.36% Netherlands 19.51M 4.53% France 17.20M 4.00% Canada 17.11M 3.97% China 16.47M 3.83% United Kingdom 11.69M 2.72% Singapore 8.38M 1.95% Ukraine 6.52M 1.52%
Scam Statistics
While some scam calls and emails are simply unwanted advertising, others can have more malicious intentions. Scammers often send out spam in an attempt to lure unknowing victims, and unfortunately, this tactic can be effective. Here are the facts:
-
The FTC reported that consumers lost $5.8 billion to fraud in 2021.
Email fraud and identity theft are especially common and damaging, with median losses of $500 per incident.
-
Between 2019-2020, scam texts increased by 146%.
Digital scams have seen a massive increase since the start of the 2020 COVID-19 Pandemic, with overall fraud increased by 70% just from 2020-2021.
-
Phone calls accounted for 18% of all scam losses in 2021.
$546 million was lost to phone call scams, making it the third worst offender. However, social media, websites and apps resulted in more losses, at $770 million (26%) and $554 million (19%), respectively.
-
59.49 million Americans lost money to phone scams in 2021.
Shockingly, up to one in three Americans report that they fell victim to a phone scam within the past year, making it one of the most common and successful scamming methods.
Phone Spam and Scam Statistics
Harmless or not, phone spam and scams are particularly common in the US. You might even be able to recall the last time you received a spam call from memory. To find out more about this side of spam, here are some interesting trends:
-
60% of all US phone calls are robocalls or spam.
Robocalls can be harmless, but with a further 40% of all calls being scams, the fact is that feeding into these calls can have truly heartbreaking results for many consumers.
-
Scam phone calls cost an average of $567.41 per scam as of 2021.
This marked a massive increase from 2020 when a scam call only cost $182 on average. That means that between 2020-2021, per-scam losses from scam calls increased by a whopping 212%.
-
70% of scam calls now use neighborhood spoofing.
The majority of scammers have become proficient at not only disguising their identities but also masking their number under one that is similar to your own on your caller ID. This allows the call to appear less threatening and more authentic, ultimately increasing the likelihood that you will answer.
Text Spam and Scam Statistics
Spam and scam texts have become more common at an alarming rate in recent years. To understand its prevalence and risks, here are some telling statistics:
-
West Virginia has the most spam texts per person, at an average of 515 per year.
Other states where spam texts were particularly common in 2021 include: Idaho (491 per person), New York (483), Texas (422), and Nevada (420).
State Average spam texts per person (2021) West Virginia 515 Idaho 491 New York 483 Texas 422 Nevada 420 -
Delivery scams are the most common type of text scams, making up 26.3% of all text scams.
While delivery scams are by far the most common, others among the most common text scams include: COVID-19: (6.5% of text scams), banking (3.5%), Apple products and hardware sweepstakes (3%), and healthcare (1.2%).
Scam type Share of total text scams Deliveries 26.3% COVID-19 6.5% Banking 3.5% Apple products and hardware sweepstakes 3.0% Healthcare 1.2% -
Men between the ages of 35-44 are the most targeted demographic for spam texts.
59.4% of spam recipients are men, while only 38.3% are women, as of 2021. Middle-aged men are more likely to be targeted, while younger women (18-34) are more likely to be targeted.
Spam Statistics FAQ
-
What percentage of email is spam?
45% of all emails are spam as of December 2021. This is down slightly from 47.3% in 2020, which was high due to the explosion of digital spam caused by the COVID-19 pandemic.
However, it is also important to note that identifying the true percentage of spam emails across several countries and billions of people is incredibly difficult. While 45% is the most commonly cited percentage for 2021, some estimates put the percentage as high as 73% of emails being spam.
Regardless of the exact percentage, it’s clear that far too many of the sent and received emails in the world are unwanted spam.
-
Who sends the most spam?
Groupon sends the most spam out of any company, sending an average of 388 emails per user per year. That’s more than one email per day, and Groupon isn’t the only offender. Other spam-happy companies include:
-
LivingSocial – 363 emails sent per user
-
Facebook – 310 emails sent per user
-
Meetup – 199 emails sent per user
-
J. Crew – 175 emails sent per user
-
Twitter – 173 emails sent per user
-
Victoria’s Secret – 160 emails sent per user
-
LinkedIn – 157 emails sent per user
-
Gilt – 155 emails sent per user
-
Kohls – 154 emails sent per user
-
Banana Republic – 145 emails sent per user
-
Gap – 139 emails sent per user
-
Old Navy – 137 emails sent per user
-
Bed Bath & Beyond – 135 emails sent per user
-
Target – 120 emails sent per user
-
-
How much spam is sent per day?
An estimated 145 billion spam emails are sent per day. However, this number also fluctuates greatly depending on the time of year and other circumstances.
For instance, in July 2021, the number of spam emails sent per day peaked at 282.93 billion and then subsequently fell to 65.5 billion in August 2021 (a 76.8% decrease). While in the same year, there were 88.21 billion spam emails sent in April and 200.24 billion sent in May (a 127% increase).
Conclusion
Spam is becoming an increasingly common issue in the US and around the world, with advertisers and scammers sending out at least 145 billion spam emails per day on average. This has led to 45% of all emails being spam and up to 60% of all calls being spam.
As of 2022, Americans are especially hard hit by the effects of spam. Now one in three Americans reports that they fell victim to a phone scam within the past year, losing over $500 per person per scam.
However, there are effective ways to combat spam. By refusing to divulge personal information with strangers on the phone or ignoring unfamiliar texts and emails, many cases of fraud can be avoided. Consumers can also choose to unsubscribe from email lists and refuse to allow cookies on websites.
Combined, all of these measures can help prevent scams and reduce the ever-growing amount of spam we’re exposed to.
References
-
Statista – Average daily spam volume worldwide from October 2020 to September 2021
-
PL – 46% of Americans now receive spam calls on their cell phone EVERY DAY. Here’s why
-
Baltimore Business Journal – Study: Spam costs companies $70B annually
-
Experian – Identity Theft Is on the Rise, Both in Incidents and Losses
-
CNBC – Consumers lost $5.8 billion to fraud last year — up 70% over 2020
-
TC – FTC: US consumers lost $770 million in social media scams in 2021, up 18x from 2017
-
CNBC – Americans lost $29.8 billion to phone scams alone over the past year
- Facts and Figures
- Social Security Statistics
- Social Media Statistics
- Cell Phone Usage Statistics
- Cryptocurrency Statistics
- White Collar Crime Statistics
- Crowdfunding Statistics
- Branding Statistics
- How Many Emails Are Sent Per Day
- Money Laundering Statistics
- Childcare Availability Statistics
- Cold Calling Statistics
- Automation And Job Loss Statistics
- Student Loan Statistics
- Spam Statistics
- Password Statistics
- Ransomware Statistics
- Christmas Spending Statistics
- Average Grocery Cost By State
- Average Screen Time Statistics
- Average Monthly Expenses
- IoT Statistics
- Gen Z Statistics
Author
Jack Flynn is a writer for Zippia. In his professional career he’s written over 100 research papers, articles and blog posts. Some of his most popular published works include his writing about economic terms and research into job classifications. Jack received his BS from Hampshire College.