Research Summary: Solar energy is quickly becoming a popular option for homeowners and companies alike. Driven by concerns over sustainability and climate change, as well as an interest in cheaper electricity generation, solar panels are everywhere now. To find out more about why solar energy has become so popular, as well as where the industry could be headed in the future, here are some crucial insights our research uncovered:
-
Solar is responsible for 3.4% of US electricity generation.
-
The US has 21,250 square miles of solar panels.
-
US solar PV generation increased by 24.14% in 2022.
-
The average cost of solar installation has dropped by over 70% since 2010.
For further analysis, we broke down the data in the following ways:
Industry | Solar Panel | Global | Projections | Solar Energy vs. Fossil Fuels | Other Renewables
Solar Energy Industry Statistics
The solar energy industry has grown massively since the 2010s. This growth has been driven by an interest in sustainability, effective marketing, and the benefits of solar energy itself. To find out more about the state of the industry, here are some interesting trends:
-
The US solar energy market is projected to have a CAGR of 17.32% through 2027.
Globally, the residential segment is expected to grow at a slightly slower, though still impressive, 14% (through 2025), while the overall industry is projected to have a CAGR of 6.9% (through 2029).
-
The global solar industry has a market size of $189.5 billion.
This is the market size as of 2022, with it projected to grow to a massive $607.8 billion by 2030.
-
Over 255,000 Americans work in the solar energy industry.
That’s compared to only 85,000 Americans who work in the wind energy industry, meaning that solar employs 200% more people.
Solar Panel Statistics
Solar panels are by far the most popular method of collecting solar energy. To dive deeper into the precedence of solar panels and how effective they are, here are some key facts:
-
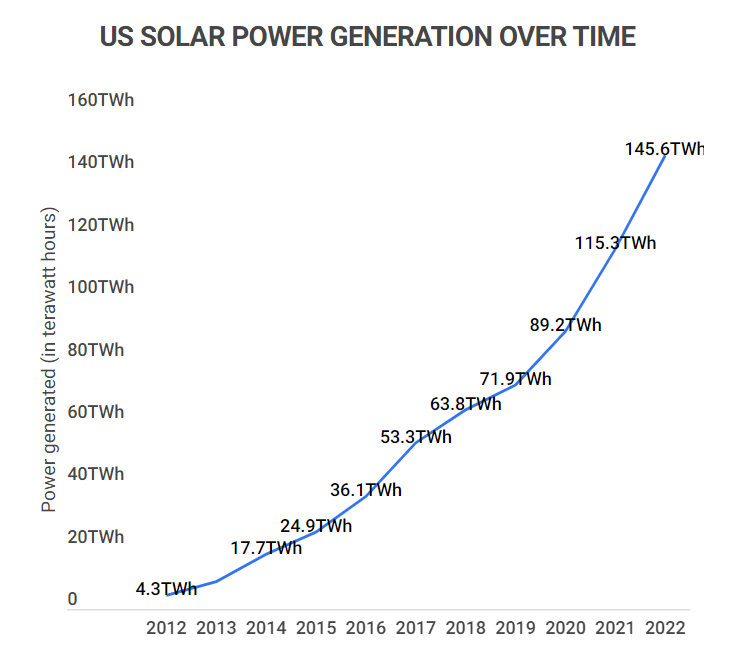
US solar power generation reached 145.6 terawatt hours in 2022.
The US is one of the biggest solar energy producers in the world and has been producing more and more every year. Just a decade ago, in 2012, the US only produced 4.3 terawatt hours of solar energy.
US Solar Power Generation Over Time
Year Energy produced (in terawatt hours) 2022 145. 2021 115.3 2020 89.2 2019 71.9 2018 63.8 2017 53.3 2016 36.1 2015 24.9 2014 17.7 2013 9.0 2012 4.3 2011 1.8 2010 1.2 -
The US installed enough solar panels in 2022 to power 22 million homes
That’s equivalent to just over 15% of all the homes in the US, showing just how much the residential segment of the solar energy industry has grown.
-
US homes and businesses alone produced 49 million megawatt hours of solar energy in 2022.
The 4% of homes and over 11,000 US businesses that use solar panels are producing more energy than they’re using, which exemplifies the effectiveness of solar energy.
Global Solar Energy Statistics
Solar energy is especially popular in the US, but other countries are also interested in expanding their solar industries. With that in mind, here are some prominent solar trends on a global scale:
-
Wind and Solar energy make up 12% of all global energy produced.
Solar and wind energy account for over 10% of electricity in more than 60 countries, with the EU having some of the most impressive numbers. On the whole, the EU now generates 22% of its energy from solar.
-
China produces the most solar power in the world, at 306.9 gigawatts.
This is then followed by the United States (95.9), Japan (74.2), Germany (58.5), and India (49.7).
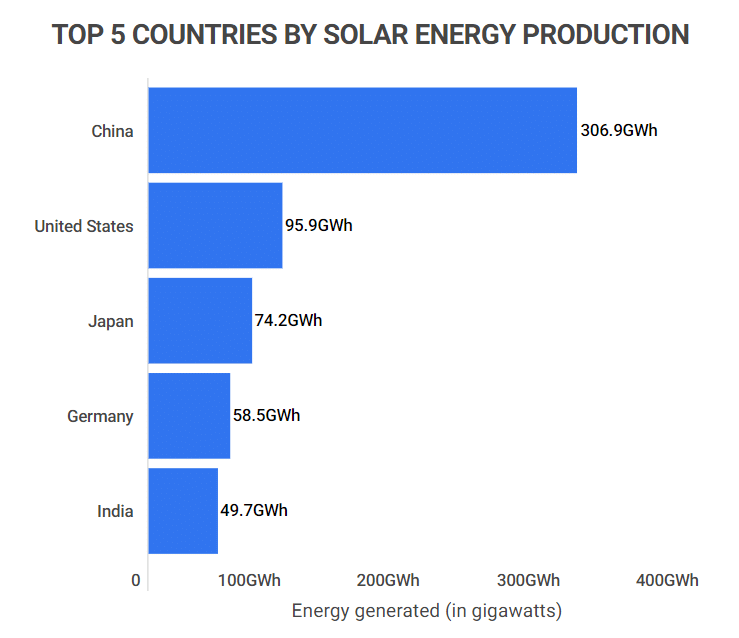
Top 10 Countries By Solar Energy Production (2021)
Country Solar energy produced (in gigawatts) China 306.9 United States 95.9 Japan 74.2 Germany 58.5 India 49.7 Italy 22.7 Australia 19.1 South Korea 18.2 Vietnam 16.7 Spain 15.9
Solar Energy Projections
The solar energy industry has already grown exponentially within the past decade, and it is poised to grow even more through the 2020s. To learn more, here are some fascinating solar industry trends:
-
Up to 13% of US homeowners will have solar panels on their roofs by 2030.
Today, approximately 4% of Americans have solar panels, meaning that within the next decade, the share of homes with solar panels could increase by 225%.
-
There needs to be a 25% year-over-year increase in solar PV generation by 2030 to reach the net zero scenario.
This equates to an increase from 1,000 TWh to at least 7,400 TWh by 2030. While not impossible, this would be challenging.
-
The US would need 7.85 billion solar panels to power its entire grid.
That’s considerably more than the 2.7 million solar panels that are currently operating throughout the country.
-
Solar could provide 45% of US energy by 2050.
Despite the fact that solar accounts for only just over 3% of the US power supply today, experts project that it could reach 40% of the power supply by 2035 and 45% by 2050.
Solar Energy vs. Fossil Fuels Statistics
Even more so than wind energy, solar energy’s main competition is the well-established fossil fuel industry. It’s taken time for homeowners and businesses alike to consider solar over coal, oil, and natural gas. Here are the facts:
-
Solar panels have an average of 15-20% efficiency.
While coal and natural gas have higher rates of efficiency, 40% and 60%, respectively, those fuel sources are also finite and need to be purchased regularly. On the other hand, the “less-efficient” solar panel only needs to be purchased once.
-
60.2% of US energy consumption comes from fossil fuels.
Natural gas is by far the most popular energy source in the US, accounting for 39.8% of all energy produced. Solar, on the other hand, only produces 3.4% of all energy.
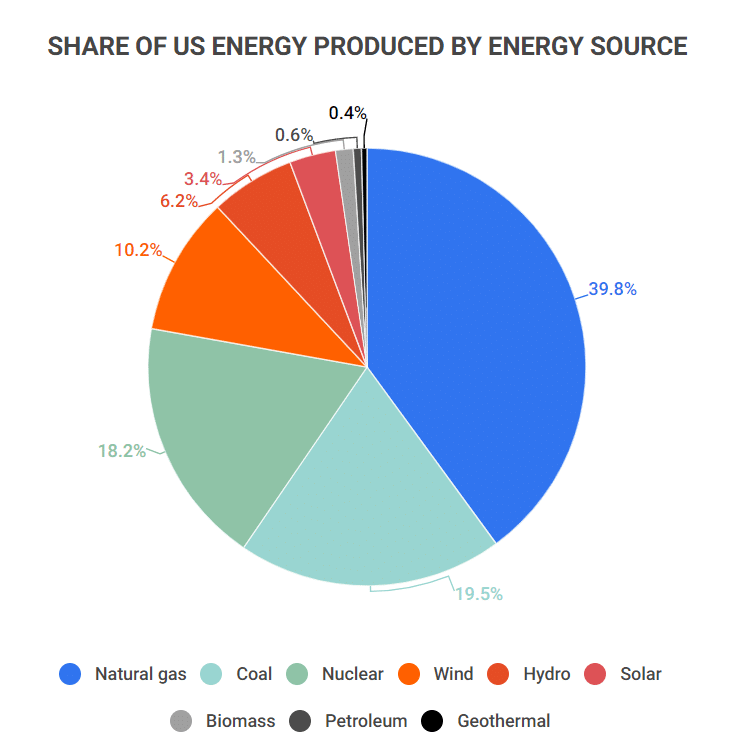
Share of US Energy Produced By Energy Source
Energy Source Share of total energy produced Natural gas 39.8% Coal 19.5% Nuclear 18.2% Wind 10.2% Hydro 6.2% Solar 3.4% Biomass 1.3% Petroleum 0.6% Geothermal 0.4%
Solar Energy Compared to Other Renewables
Solar energy isn’t the only eco-friendly option out there, as wind and hydro energy are also popular options. While much of the choice of which energy to use comes down to the climate and geography of the region, certain energies can be beneficial for other reasons as well. Consider these statistics:
-
All renewable energy accounts for 21.5% of total US energy production.
Of that 21.5%, Wind energy accounts for just under half of it (46.5%), hydro accounts for 28.8%, and solar accounts for 15.8%.
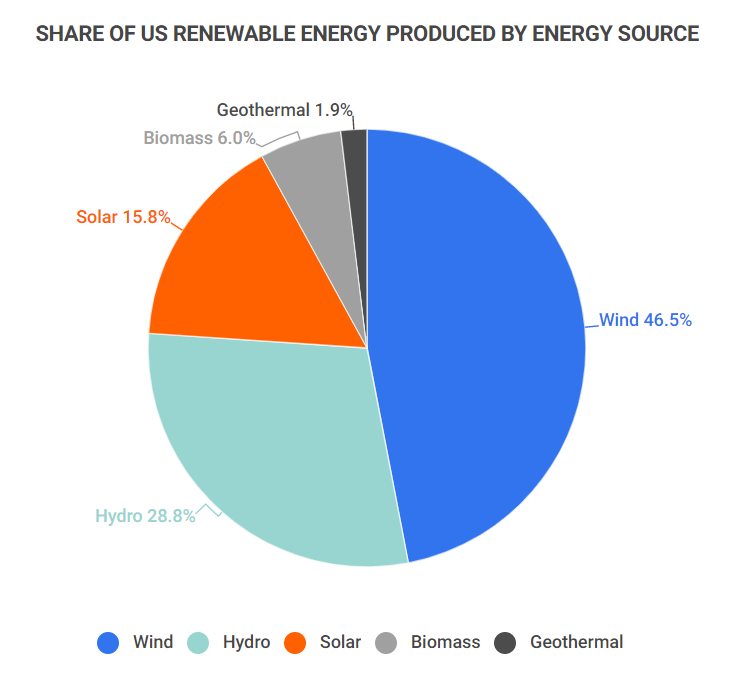
Share of US Renewable Energy Produced By Energy Source
Energy Source Share of total renewable energy produced Wind 46.5% Hydro 28.8% Solar 15.8% Biomass 6.0% Geothermal 1.9% -
Solar energy grew 41% faster than wind year-over-year.
In 2022, solar energy grew by over 24%, while wind grew by 17%. While this difference might not seem like a lot, it’s actually a significant advantage for solar.
Solar Benefits
There are many benefits that come along with installing and producing energy from solar panels. To find out more about these benefits, here are some interesting facts:
-
Americans save an average of $1,500 on electricity after installing solar panels.
In total, the average American can expect to save between $20,000 – $97,000 over the lifespan of their solar panel system. The disparity largely depends on the average utility cost in the area, average electricity use, available sunshine, and the quality of the system.
-
As of 2022, the US produces enough solar energy to offset 161 million metric tons of carbon dioxide emissions.
That’s enough to power 25 million US homes, and while more work needs to be done to reduce and offset carbon emissions, this is certainly a start.
-
Residential solar installation only costs $3 per watt in 2023.
While these costs do vary by state, with Arizona having the cheapest average cost of $2.44 and Michigan being the most expensive at $3.78, the overall cost has essentially halved since 2010.
Solar Energy FAQ
-
Can solar power replace fossil fuels?
Yes and no; solar can replace some aspects of fossil fuels, but not others. On the sustainability front, solar is an excellent replacement option. It admits little to no greenhouse gases and can actually be cheaper than coal or natural gas in the long run.
However, solar’s 15-20% efficiency is less than both coal and natural gas, even in ideal conditions. In suboptimal conditions, such as areas with colder and cloudier climates, solar can be a very limiting option.
With that in mind, it’s important to invest in other renewable energies besides solar. While solar might not be an ideal replacement in northern Canada, as opposed to Arizona, wind or hydropower could pick up the slack.
-
Is solar power cleaner than fossil fuels?
Yes, solar power is absolutely cleaner than fossil fuels. The process of creating energy with the sun produces no harmful pollutants or greenhouse gas emissions and is essentially infinite rather than finite.
Further, solar panels themselves are mostly made from silicon and glass, which can be made from sand (an abundantly available resource). Producing solar panels only creates 50g of carbon emissions. This gives solar an edge over batteries, for example, which require a carbon-heavy process to be produced (up to 16,000kg).
-
What is the main disadvantage of using solar energy?
The main disadvantage to using solar energy is temporary weather disruptions. Even in areas with ideal climates, the energy generated by solar panels can be reduced or disrupted by storms and clouds. That’s not great during a week-long storm or, even worse, a four to six-month-long winter.
Luckily, these problems can be mitigated through proper energy storage. Systems put in place that can take excess energy produced by solar panels on a sunny day, and store it away for a rainy day, are a great counter to this issue.
Conclusion
Solar is the third highest producer of renewable energy in the US and grew by a massive 24.14% in 2022 alone. Currently, the US solar industry produces 145.6 terawatt hours of energy, which is enough to power up to 15% of US homes.
Realistically though, only 4% of US homes currently use solar, and solar only accounts for 3.4% of all energy produced in the US. On the other hand, natural gas is still king, accounting for just under 40% of all energy produced.
However, these numbers will likely continue to change, as solar is expected to have a significant CAGR of 17.32% through 2027. Believe it or not, experts project that solar could provide 40% of our energy by 2035.
References
-
EIA – What is U.S. electricity generation by energy source?
-
8 Billion Trees – How Many Solar Panels To Power the US & Every State? See Full Breakdown
-
Grand View Research – Solar Energy Systems Market Size, Share & Trends Analysis Report By Product
-
Statista – Solar power net generation in the United States from 2000 to 2022
-
DW – Wind and solar now generate record 12% of global electricity
-
Forbes – How Much Do Solar Panels Save The Average Homeowner?
-
CBS News – Number of Americans using solar power expected to more than triple by 2030
-
LASolar – The efficiency of solar Panels when compared with fossil Fuels
Author
Jack Flynn is a writer for Zippia. In his professional career he’s written over 100 research papers, articles and blog posts. Some of his most popular published works include his writing about economic terms and research into job classifications. Jack received his BS from Hampshire College.