- Business Statistics
- Startup Statistics
- Cloud Adoption Statistics
- Customer Loyalty Statistics
- Nonprofit Statistics
- Affiliate Marketing Statistics
- Cart Abandonment Rate Statistics
- Ridesharing Statistics
- Call Center Statistics
- eLearning statistics
- Customer Service Statistics
- Customer Experience statistics
- Entrepreneur Statistics
- Outsourcing Statistics
- Gross Revenue for Marketing and Advertising
- Sales Statistics
- MBA Statistics
- Average Small Business Revenue + Profit Margin
- How Much Do Employee Benefits Cost?
Ridesharing research summary. Ridesharing apps are commonly used, whether you were on vacation or simply wanted to get around the neighborhood. From Uber to Lyft, these popular apps have completely changed how we approach travel in urban areas. When it comes to ridesharing, our extensive research shows that:
-
The global ridesharing market is valued at $95.09 billion as of 2022.
-
36% of Americans have now used a ridesharing app, more than double that of the percentage who used them in 2015.
-
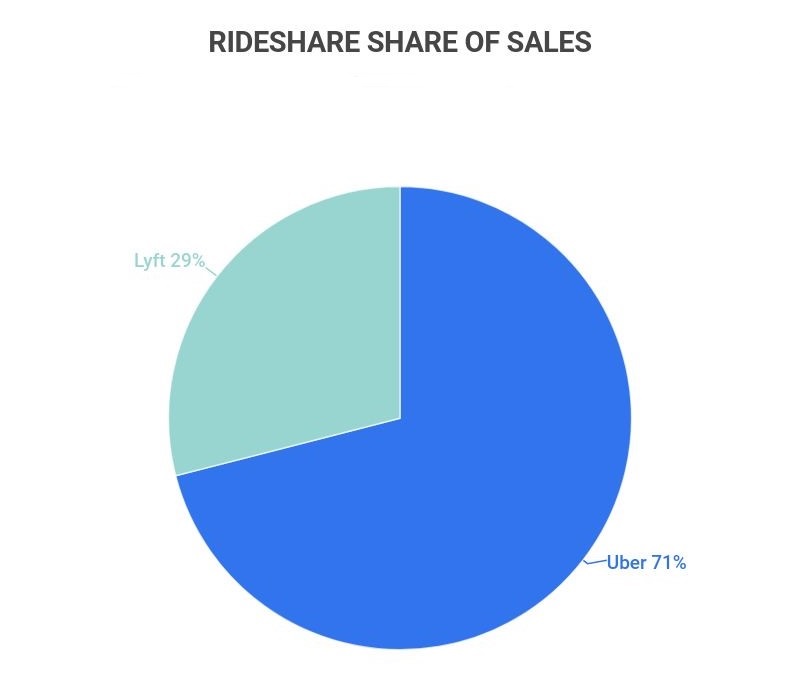
Uber has a 71% share of sales in the U.S. rideshare market, whereas Lyft only has 29%.
-
The global ridesharing market is projected to reach a value of $185.1 billion by 2026.
-
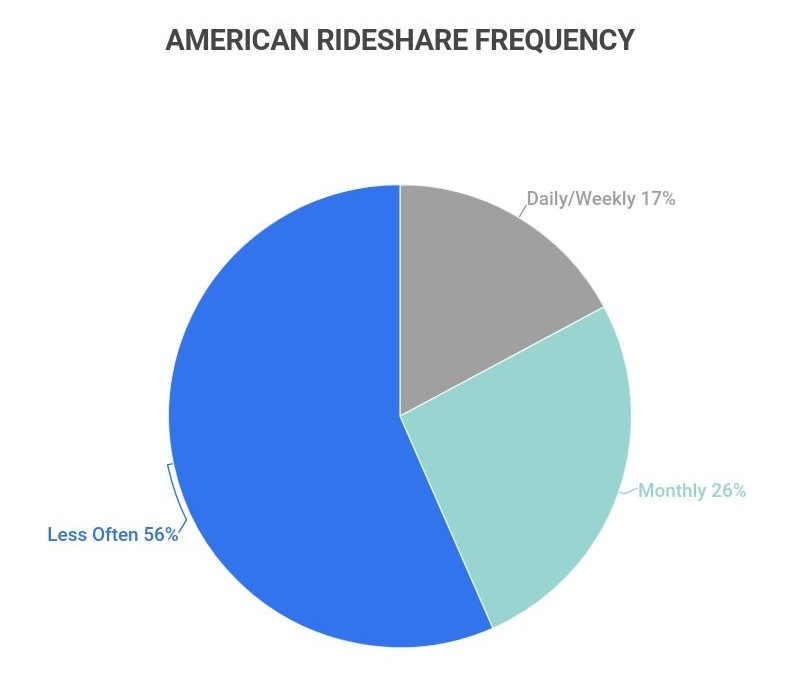
26% of ridesharing app users utilize ridesharing services monthly.
For further analysis, we broke down the data in the following ways:
Uber vs. Lyft | Uber Users and Drivers | User | Trends and Projections
General ridesharing industry statistics
In just over five years, ridesharing has grown from a small industry to a major method of transportation. Here are the facts about ridesharing in the U.S. and across the world:
-
As of 2021, the rideshare industry made $117 billion in sales.
That number is up 50% from 2020, showing just how rapidly ridesharing services are growing. Further, that trend is expected to continue, with ridesharing sales projected to grow through 2026.
-
36% of Americans have used a ridesharing service.
That’s more than double the percentage of users in 2015 when only 15% of Americans used ridesharing services. It’s also worth noting that general awareness of ridesharing services has also grown in this time. In 2015, 33% of the U.S. population hadn’t heard of ridesharing services, but in 2021 that number is only 3%.
-
Uber generated $31.8 billion in revenue throughout 2022.
That’s a massive 82% increase from 2021. Lyft, on the other hand, reached approximately $4.09 billion in revenue. While Uber is significantly larger than Lyft, both ridesharing services have seen an uptick in sales compared to 2020.
-
Uber and Lyft are responsible for 6% of vehicle miles traveled (VMT) across the U.S.
That’s up from only 1% in 2016, meaning that these ridesharing services make up over 5x the VMT in only five years. Further, in San Fransico, that number is up to 13%.
-
China has the highest share of rideshare users, with 44% of the population using them.
Russia is #2, with 42% of the population using rideshare services, followed by the United States (36%), Brazil (30%), and the United Kingdom (11%).
Share of ridesharing users by country
Country % of Pop. That Uses Ridesharing China 44% Russia 42% United States 36% Brazil 30% United Kingdom 11% -
The global ridesharing market is valued at $95.09 billion.
While this is already considerably more than the market value of 2020 and years prior, it’s still expected to grow. By 2026 the global rideshare market is projected to reach a value of $185.1 billion.
Ridesharing industry: Uber vs. Lyft
Though Uber takes up a larger portion of the ridesharing market than Lyft, both are commonly used in the United States. When it comes to comparing the two ridesharing services, our research shows that:
-
Lyft has approximately 20.3 million monthly active users.
The average sale per customer is $66. While this is less than Uber, it still shows a profitable and lucrative business, despite the competition.
-
Uber has a whopping 131 million monthly active users.
The average sale per customer is $72 as of January 2022 (a 19% increase year-over-year). And even at its massive size, Uber continues to grow.
-
As of 2022, Uber has a 71% share of sales in the U.S. rideshare market, whereas Lyft only has 29%.
However, both have seen significant sales increases since 2021. As of January 2022, Uber’s sales are up 84%, and Lyft sales are up 62% year-over-year.
-
Uber has 9% higher sales per customer on average compared to Lyft.
The average Uber customer pays $72 per rideshare service, while the average Lyft customer pays $66. As a whole, though, both of these costs have increased since 2021, with Uber seeing a 19% year-over-year increase and Lyft seeing a 16% year-over-year increase.
Ridesharing industry by Uber users and drivers
As the largest ridesharing service in the U.S., Uber is becoming a larger and larger part of transportation. This is especially true in the cities, where Uber drivers can account for over 10% of VMT. According to our research:
-
As of 2022, over 14 million Uber trips are taking place every day.
That’s over 5 billion trips per year. Further, there have been an estimated 10 billion Uber trips completed as a whole. Though, if 2022’s numbers are anything to go by, that number will rapidly increase over time.
-
Uber generated $17.4 billion in revenue in 2021.
Uber’s revenue increased massively between 2021 and 2022, but this increase also started after a dip in 2020. 2021’s revenue was a 36% increase from $11.1 billion in 2020 and a 19% from 2019’s revenue of $14.1 billion. Any way you look at it, Uber has made a swift recovery amid the COVID-19 Pandemic.
-
Uber currently operates in more than 85 countries.
Some of the most popular include the United States, Australia, Bangladesh, Belgium, Brazil, Canada, France, Germany, Hong Kong, India, Italy, Japan, Mexico, Portugal, Saudi Arabia, South Africa, Spain, Sweden, and the United Kingdom. Overall, Uber is available in over 10,000 cities worldwide.
-
Uber has roughly 1 million drivers in the U.S. alone.
And in California alone, that number averages at around 209,000 each quarter. Uber also has a presence globally, with an estimated number of drivers between 3-4 million.
-
The average Uber driver makes $364 per month.
That might seem like a small amount, but it’s partially due to the fact that most Uber drivers work part-time. In fact, the average annual income for full-time Uber drivers is $36,525.
Ridesharing user statistics
Ridesharing usage is still heavily divided between certain demographics. After all, locations with less demand will see far less usage. From community to income, here are some facts about ridesharing users:
-
In urban areas, more than double the percentage of the population uses ridesharing services.
Rural areas are far less likely to use ridesharing services. For instance, in major rideshare using demographics, such as college graduates and those making more than $75K per year), roughly 70% of the population uses ridesharing. By contrast, only 32% of those in either demographic use ridesharing in rural areas.
-
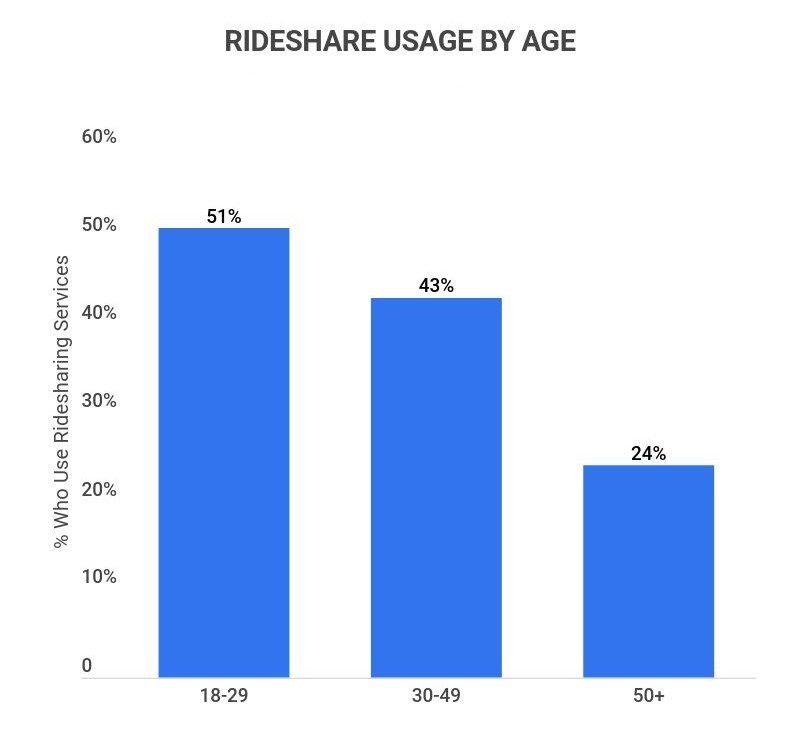
Those between 18-29 are most likely to use ridesharing apps, with at least 51% using them.
Generally speaking, rideshare usage goes down more and more as age increases, with 43% of those between 30-49 and 24% of those 50+ saying they’ve used a rideshare service before.
-
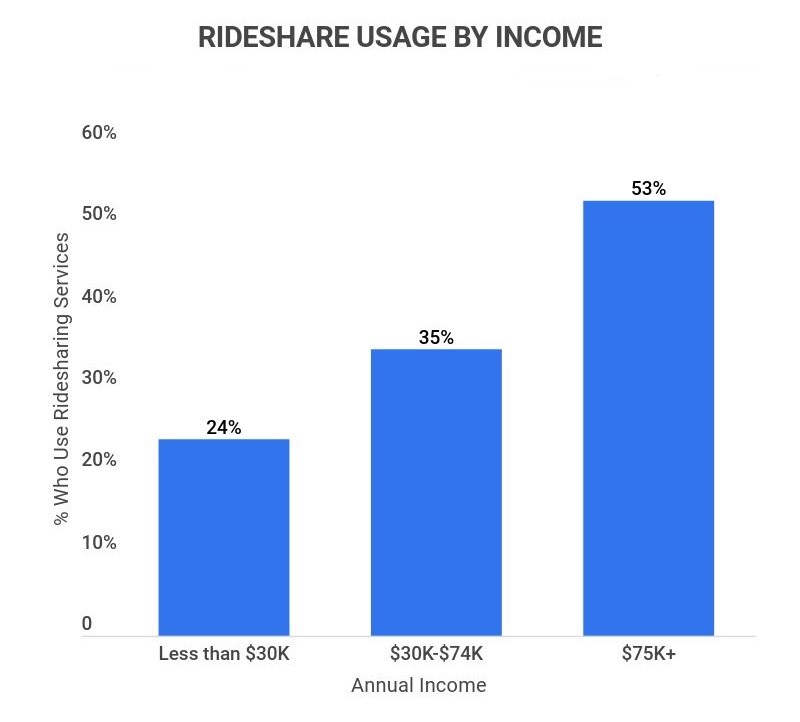
Those who make $75K or more per year are more likely to use ridesharing services, with 53% saying they’ve used one.
Generally speaking, that percentage goes down more and more as income decreases, with 35% of those making between $30K-$74K and only 24% of those making under $30K per year saying they’ve used ridesharing services.
-
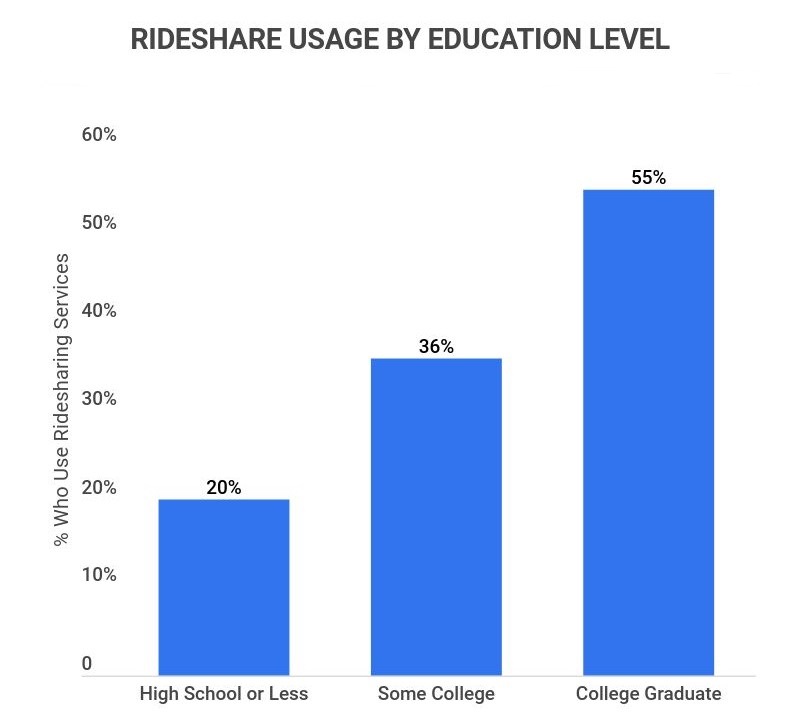
College graduates use ridesharing the most over any other demographic, with 55% saying they’ve used the service before.
That’s far more than any other educated demographic, with only 20% of those with a High School diploma or less saying the same, and 36% of those with some college.
-
70% of people who regularly walk or ride a bike also use ridesharing services.
In contrast, only 31% in that demographic are nonusers. Meanwhile, even though 64% of those who own a personal vehicle have used a rideshare service before, 78% still prefer to use their own vehicle.
-
26% of ridesharing app users utilize ridesharing services monthly.
Another 17% use ridesharing services daily. However, the vast majority (56%) only use ridesharing services once in a while.
Urban vs. rural ridesharing demographics
| Demographic | % of Urban Pop. That Uses Ridesharing | % of Rural Pop. That Uses Ridesharing |
|---|---|---|
| Ages 18-29 | 55% | 36% |
| College Graduates | 70% | 32% |
| $75K+ Annual Income | 71% | 32% |
Rideshare frequency and transit preferences
| Transit Preference | % Who Rideshare Daily/Weekly | % Who Rideshare Occassionally | % Who Never Rideshare |
|---|---|---|---|
| Drives car daily/weekly | 63% | 85% | 84% |
| Walks or rides bike daily/weekly | 70% | 41% | 31% |
| Takes taxi daily/weekly | 55% | 3% | 2% |
| Takes public transit daily/weekly | 56% | 19% | 9% |
Ridesharing industry trends and projections
Ridesharing has become exponentially more popular just within the past five years. Of course, while the industry did take a dip in sales during the start of the 2020 COVID-19 Pandemic, it has recovered rapidly. Here are some trends and predictions for the ridesharing industry:
-
From 2017 to 2021, the rideshare market value has increased 12x over.
In 2017 the rideshare market was valued at only $6.68 billion, but as of 2022, that number has reached $95.09 billion. That’s a huge increase and represents massive growth.
-
Between 2021 and 2026, the ridesharing industry is expected to experience a CAGR of 16.6%.
As far as CAGRs go, that’s a pretty high rate. It represents a projected growth from $85.8 billion in 2021 to $185.1 billion in 2026.
Ridesharing industry FAQ
-
How many rideshare drivers are there in the U.S.?
There are over 1.7 million rideshare drivers in the U.S., mostly split up between Uber and Lyft drivers. Uber has roughly 1 million drivers, whereas Lyft has 700,000.
For Uber, the company has seen a steady increase in drivers since the app’s conception. From 2014-to 2015 alone, the number of U.S. drivers doubled from 160,000 to 327,000. Then, that 327,000 grew to the number it is today.
-
How big is the ridesharing industry?
The ridesharing industry has grown to be big in a short period of time. As of 2022, the industry has a market value of $95.09 billion. That’s over a 12x increase from 2017 when the market value was $6.68 billion.
Currently, 36% of Americans have used rideshare services, up from only 15% in 2015. Further, Uber and Lyft are responsible for 6% of vehicle miles traveled (VMT) across the U.S. As of 2022, companies like Uber have already expanded outside of the U.S. and now operate in over 85 countries.
Overall, the ridesharing industry is expected to continue getting bigger. By 2026, experts predict that the industry will be worth $185.1 billion.
-
What is Lyft’s market share?
Lyft’s market share is 29% of sales. While that might not seem like a lot compared to Uber, Lyft has approximately 18.6 million monthly active users, with the average sale per customer being $66. That easily puts the company’s profits in hundreds of millions each quarter.
-
Yes, Uber made a profit in 2022. While Uber did not make a profit in 2021, 2022’s 82% spike in revenue certainly aided in finally providing one. The year signified a incremental margin of 10%.
As for why Uber hadn’t made a profit in 2021, this is because of the company’s investment in the Chinese ride-hailing giant Didi Global Inc. On the whole, Uber recorded a net loss of $2.4 billion.
-
What percentage do ridesharing companies take?
Ridesharing companies like Uber take an average of 24.7% per trip. That means that if a customer paid $70 for a ride, Uber would take just over $17 of that payment for themselves. This number is similar for Lyft, with all rideshare companies typically taking 15-25%.
Conclusion
Established in 2009, Uber and other ridesharing companies have become bigger than ever before. In fact, in 2015, only 66% of Americans had heard of ridesharing, and only 15% used ridesharing services. As of 2021, a whopping 97% have heard of ridesharing services, and 36% now use them. No wonder the ridesharing industry is worth $95.09 billion.
Of course, there are still gaps. While ridesharing has taken off in the cities among younger and highly educated individuals, rural areas and older citizens are still slow to adopt it. The rural-city divide will likely be the most challenging to overcome, as issues like lack of drivers, expensive trips, and private vehicle ownership will make customers less likely to use the service.
Despite that, the ridesharing industry is still expected to have massive and healthy growth in upcoming years. For instance, with a predicted CAGR of 16.6%, the industry’s market value could reach over $185 billion by 2026.
Sources
-
GlobeNewswire. “Global Ride Sharing Market Report 2021.” Accessed on February 20th, 2022.
-
Bloomberg Second Measure. “Uber vs. Lyft: Who’s tops in the battle of U.S. rideshare companies.” Accessed on February 20th, 2022.
-
Statista. “Ride-sharing market size worldwide in 2020 and 2021.” Accessed on February 21st, 2022.
-
Pew Research Center. “More Americans are using ride-hailing apps.” Accessed on February 21st, 2022.
-
Lyft. “Lyft Announces Solid Q4’21 and Fiscal 2021 Results.” Accessed on February 21st, 2022.
-
Wamu88.5. “Uber And Lyft Say They Make Up 7% Of Miles Traveled By Vehicles In D.C.” Accessed on February 21st, 2022.
-
Statista. “Country ranking with the highest share of ridesharing* users in 2018.” Accessed on February 21st, 2022.
-
Ride Share Guy. “How Many Uber Drivers Are There?” Accessed on February 21st, 2022.
-
Uber. “Use Uber in cities around the world.” Accessed on February 21st, 2022.
-
TheStreet. “How Much Do Uber and Lyft Drivers Make?” Accessed on February 21st, 2022.
-
Pew Research Center. “On-demand: Ride-hailing apps.” Accessed on February 22nd, 2022.
-
Grand View Research. “Ride Sharing Market Size(2019 – 2025).” Accessed on February 22nd, 2022.
- Business Statistics
- Startup Statistics
- Cloud Adoption Statistics
- Customer Loyalty Statistics
- Nonprofit Statistics
- Affiliate Marketing Statistics
- Cart Abandonment Rate Statistics
- Ridesharing Statistics
- Call Center Statistics
- eLearning statistics
- Customer Service Statistics
- Customer Experience statistics
- Entrepreneur Statistics
- Outsourcing Statistics
- Gross Revenue for Marketing and Advertising
- Sales Statistics
- MBA Statistics
- Average Small Business Revenue + Profit Margin
- How Much Do Employee Benefits Cost?
Author
Jack Flynn is a writer for Zippia. In his professional career he’s written over 100 research papers, articles and blog posts. Some of his most popular published works include his writing about economic terms and research into job classifications. Jack received his BS from Hampshire College.