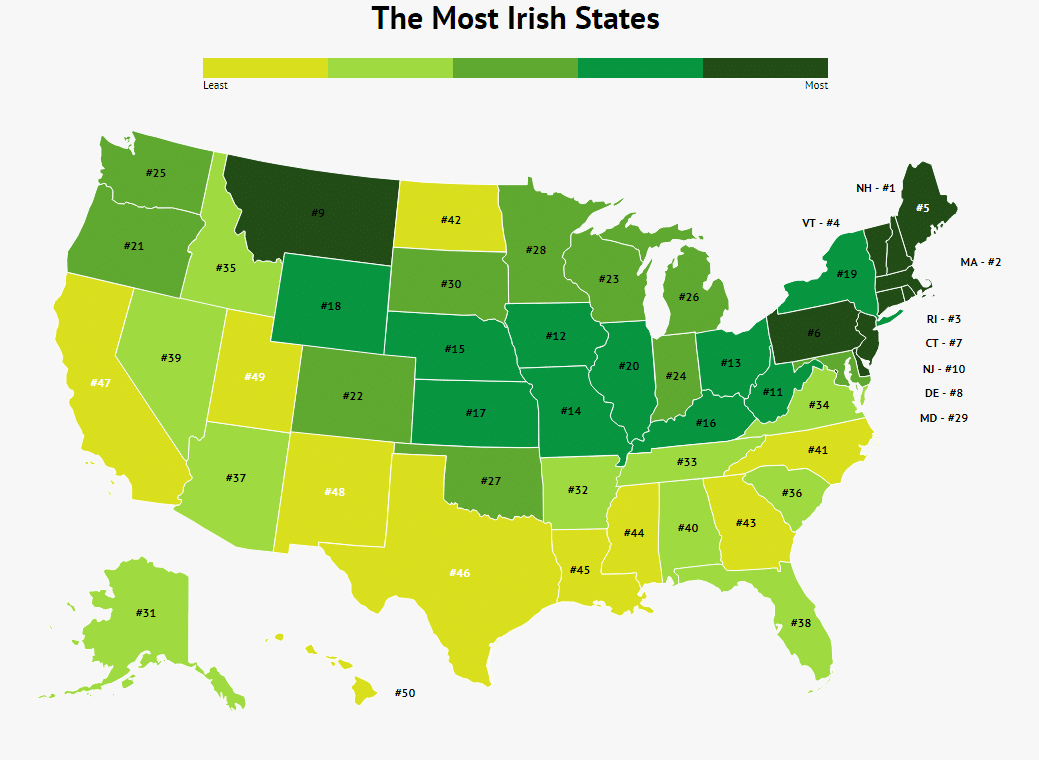
The most Irish state in the U.S. is New Hampshire, where 20.2% of the state’s residents are Irish.
The least Irish state in the U.S. is Hawaii, where only 4.3% of the state’s residents are Irish.
The most Irish city in the U.S. is Ocean City, NJ, which is 30.22% Irish.
25.75% of the entire U.S. adult population has had Irish ancestors.
St. Patrick’s Day is approaching.
For some that means parades, corned beef, and avoiding being pinched. However, for others it’s more than just a fun holiday– It’s a day to honor their heritage.
While 4.9 million people call Ireland home, 32 million Americans identify as Irish. That’s right, America is home to more Irish Americans than Ireland is home to Irish. However, some states are far more Irish than others.
To find the states where St. Patrick’s Day isn’t just a day on the calendar but a true event, we found the states where the most residents are of Irish descent.
The results? The Northeast is kelly green.
How We Determined This
To find the most Irish states, we turned to US Census Ancestry data.
From there, we simply divided the total number of residents with Irish ancestry by total number of residents. The higher percent of Irish residents, the more Irish the state.
This data is self-reported, which relies on people accurately knowing their own heritage. Considering, 21% of Americans are unable to name a single great-grandparent, chances are good these results are skewed.
So, we can’t guarantee there aren’t a lot of unaware Irish folks out in the South West, or that in people in areas with a robust Irish population don’t incorrectly assume they are also Irish.
For the cities, we did a similar process, looking at cities and metro areas over 25,000 residents.
1. New Hampshire

Percent Irish: 20.2%
Number Of Irish Residents: 272,613
New Hampshire is the most Irish states in the whole country. An impressive 20.2% of folks in New Hampshire claim Irish ancestry. That means 1-in-5 New Hampshire residents hail from the Emerald Isle.
2. Massachusetts

Percent Irish: 20%
Number Of Irish Residents: 1,354,176
While Massachusetts has lost it’s spot as the #1 most Irish state, the state is still pretty Irish. Don’t believe me? Go to Boston on St. Patrick’s Day, between the bars full of cheery Irish patrons or the legendary parade, it’s easy to see Massachusetts is Irish and proud.
3. Rhode Island

Percent Irish: 18%
Number Of Irish Residents: 186,040
Kiss Rhode Island, because it’s pretty Irish. 18% of Rhode Islanders claim to have Irish ancestors on their family tree.
4. Vermont

Percent Irish: 17%
Number Of Irish Residents: 106,139
Vermont is the 4th most Irish state in the whole country. While we can’t guarantee they have the luck of the Irish, 17% do have Irish roots.
5. Maine

Percent Irish: 17%
Number Of Irish Residents: 222,310
Raise a pint of Guinness to Maine, or at least for the 17% of Mainers of Irish ancestry. A sizeable 222,310 of those who live in Maine claim an Irish ancestor (or more!).
6. Pennsylvania

Percent Irish: 16%
Number Of Irish Residents: 1,998,833
An impressive 16% of Pennsylvanians are of Irish ancestry. Pennsylvania is one of only two states in the top 10 not to touch the Atlantic Ocean. Although it is worth noting the state is only about 50 miles away.
7. Connecticut

Percent Irish: 15%
Number Of Irish Residents: 544,222
Connecticut has (more than) a little Irish in it. Over half a millions Connecticut residents believe they have Irish ancestry. That ends up being a shamrock green 15%.
8. Delaware

Percent Irish: 14%
Number Of Irish Residents: 133,776/pgt;
The 8th most Irish state is Delaware. Another coastal, northeastern state, 14% of residents identify as Irish.
9. Montana

Percent Irish: 14%
Number Of Irish Residents: 144,105
Montana may bring to mind cowboys and yogi bear, but it should also bring to mind shamrocks. 14% of Montana residents identify as being of Irish descent. Montana is the furthest west state on the top 10.
10. New Jersey

Percent Irish: 13%
Number Of Irish Residents: 1,188,978
In 10th place, but still plenty green is New Jersey. 1,188,978 folks in the garden state have Irish heritage.
What are the most Irish cities?
You can keep scrolling to see how Irish your state is and the number of residents with a bit more reason than others to wave the shamrock flag.
However, first here are the more Irish cities in the US. Unsurprisingly, many of them are inside of the most Irish states.
Most Irish Cities
- Ocean City, NJ – 30.22%
- Butte-Silver Bow, MT – 28.44%
- Barnstable Town, MA – 26.53%
- Albany-Schenectady-Troy, NY – 21.55%
- Auburn, NY – 21.49%
- Manchester-Nashua, NH – 20.83%
- Boston-Cambridge-Newton, MA-NH – 20.80%
- Scranton–Wilkes-Barre, PA – 20.51%
- Syracuse, NY – 20.30%
- Kingston, NY – 20.29%
- Dubuque, IA – 19.71%
- Glens Falls, NY -19.64%
- Hudson, NY – 19.64%
- Oneonta, NY – 19.35%
- Rutland, VT – 19.12%
- Portland-South Portland, ME – 18.80%
- Bennington, VT – 18.79%
- Keene, NH – 18.68%
- Torrington, CT – 18.44%
- Elmira, NY – 18.39%
- Norwich-New London, CT – 18.38%
- Barre, VT – 18.30%
- Bradford, PA – 18.17%
- Pontiac, IL – 18.14%
- Worcester, MA – 18.07%
States Ranked From Most Irish To Least
| Rank | State | Percent Irish | Irish Residents |
|---|---|---|---|
| 1 | New Hampshire | 20.2% | 272,613 |
| 2 | Massachusetts | 19.8% | 1,354,176 |
| 3 | Rhode Island | 17.6% | 186,040 |
| 4 | Vermont | 17.0% | 106,139 |
| 5 | Maine | 16.6% | 222,310 |
| 6 | Pennsylvania | 15.6% | 1,998,833 |
| 7 | Connecticut | 15.2% | 544,222 |
| 8 | Delaware | 14.0% | 133,776 |
| 9 | Montana | 13.7% | 144,105 |
| 10 | New Jersey | 13.4% | 1,188,978 |
| 11 | West Virginia | 13.3% | 241,354 |
| 12 | Iowa | 13.0% | 408,494 |
| 13 | Ohio | 12.7% | 1,480,776 |
| 14 | Missouri | 12.4% | 757,798 |
| 15 | Nebraska | 12.1% | 230,807 |
| 16 | Kentucky | 11.4% | 508,220 |
| 17 | Kansas | 11.3% | 328,082 |
| 18 | Wyoming | 11.3% | 65,438 |
| 19 | New York | 11.2% | 2,192,255 |
| 20 | Illinois | 11.1% | 1,420,207 |
| 21 | Oregon | 10.9% | 451,788 |
| 22 | Colorado | 10.8% | 608,412 |
| 23 | Wisconsin | 10.7% | 616,950 |
| 24 | Indiana | 10.6% | 705,604 |
| 25 | Washington | 10.2% | 758,368 |
| 26 | Michigan | 10.2% | 1,020,649 |
| 27 | Oklahoma | 10.1% | 398,464 |
| 28 | Minnesota | 10.1% | 559,686 |
| 29 | Maryland | 10.0% | 602,275 |
| 30 | South Dakota | 10.0% | 87,057 |
| 31 | Alaska | 9.6% | 71,084 |
| 32 | Arkansas | 9.6% | 287,153 |
| 33 | Tennessee | 9.3% | 620,746 |
| 34 | Virginia | 9.0% | 764,929 |
| 35 | Idaho | 9.0% | 155,138 |
| 36 | South Carolina | 8.7% | 437,697 |
| 37 | Arizona | 8.4% | 595,542 |
| 38 | Florida | 8.4% | 1,758,679 |
| 39 | Nevada | 8.3% | 245,946 |
| 40 | Alabama | 8.0% | 391,046 |
| 41 | North Carolina | 8.0% | 821,675 |
| 42 | North Dakota | 7.6% | 57,158 |
| 43 | Georgia | 7.1% | 738,017 |
| 44 | Mississippi | 7.0% | 207,836 |
| 45 | Louisiana | 6.5% | 303,269 |
| 46 | Texas | 6.1% | 1,726,259 |
| 47 | California | 5.9% | 2,336,215 |
| 48 | New Mexico | 5.9% | 123,337 |
| 49 | Utah | 5.6% | 174,068 |
| 50 | Hawaii | 4.3% | 61,226 |
Author
Kathy is the head of content at Zippia with a knack for engaging audiences. Prior to joining Zippia, Kathy worked at Gateway Blend growing audiences across diverse brands. She graduated from Troy University with a degree in Social Science Education.