- Tech Industry Statistics
- MFA Statistics
- Streaming Services Statistics
- Mobile Vs. Desktop Usage Statistics
- AI Statistics
- Live Streaming Statistics
- Zoom Meeting Statistics
- Cord Cutting Statistics
- Digital Transformation Statistics
- Virtual Reality Statistics
- How Fast Is Technology Advancing
- Mobile Commerce Statistics
- SaaS Statistics
- Machine Learning Statistics
- Diversity In High Tech
- Cyber Security Statistics
- Ecommerce Statistics
- Tech Industry
- Gaming Industry
- Renewable Energy Job Creation
- Smartphone Industry
- Cybercrime Statistics
- Amazon Statistics
- Personalization Statistics
Research Summary: With the ever-growing importance of the internet and mobile technology, the rapid growth of mobile commerce is unsurprising. And, if you’re a marketer or business owner, you’re well aware of how mobile commerce can affect profits. Overall, when it comes to m-commerce in the U.S., our extensive research shows that:
-
As of 2023, 79% of smartphone users have used their mobile devices to make a purchase.
-
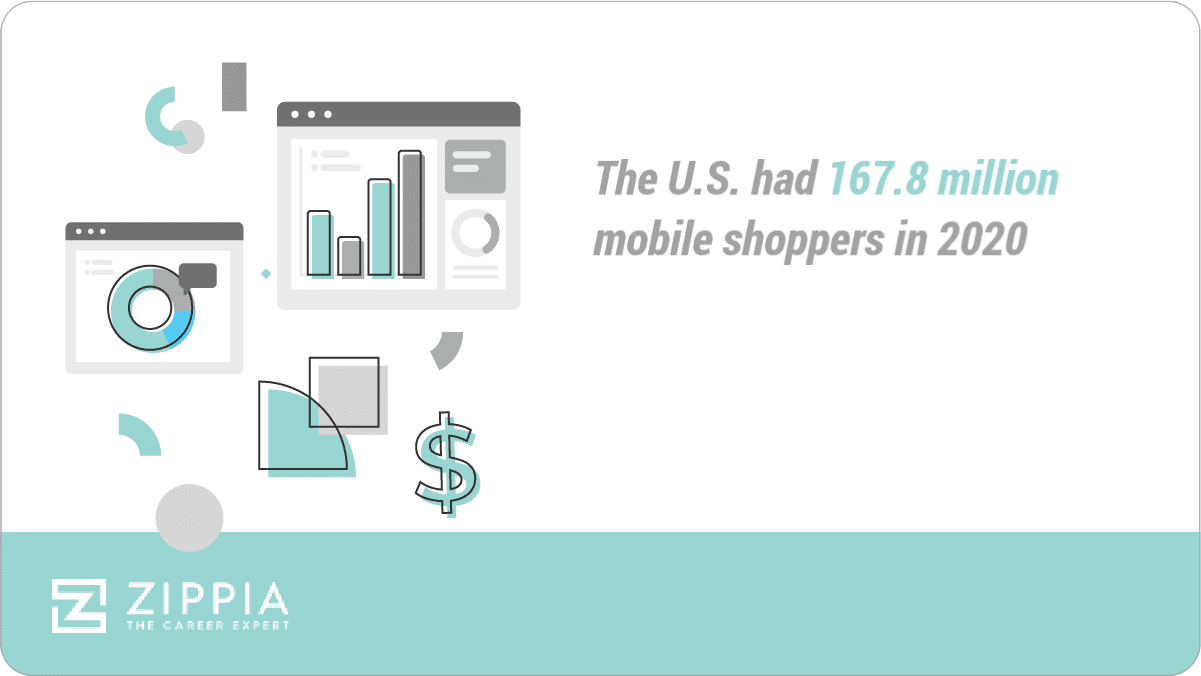
In 2020 alone, there were approximately 167.8 million mobile shoppers in the U.S.
-
U.S. revenue generated by m-commerce amounted to $431 billion in 2022.
-
M-commerce market share comprises 73% of total e-commerce.
-
Smartphone commerce alone is expected to make up 44% of all e-commerce sales by 2024.
-
57% of US customers have used a mobile retail application to research a commoditity.
-
U.S. m-commerce is expected to experience a massive CAGR of 34.9% between 2020–2026.
For further analysis, we broke down the data in the following ways:
Mobile Shopper | M-Commerce Optimization | Trends and Projections
General Mobile Commerce Statistics
Given the obvious prevalence of mobile commerce in the United States, these statistics will cover some general trends. That way, marketers and consumers alike can understand the current state of the market. According to our research:
-
As of 2023, the m-commerce market comprises nearly 73% of total e-commerce.
What’s more, this is a 39.1% increase from 2016, when m-commerce was only 52.4% of the e-commerce market. In all likelihood, the increased reliance on mobile devices will only see this percentage increase further over time.
-
Global m-commerce revenue has reached $3.5 trillion in 2021.
That’s a 35% increase from 2020 when revenue reached $2.9 trillion. Further, this also means that the U.S. market is responsible for around 11-12% of the world’s total m-commerce revenues.
-
The average U.S. consumer spends roughly $100 per m-commerce purchase.
That number is split between an average of $94.85 when purchasing from a mobile phone and $101.96 when purchasing from a tablet.
-
53.9% of the total annual retail e-commerce sales in the U.S. come from m-commerce.
That’s a 9.2% increase from 2021’s expected forecast. Further, m-commerce now makes up roughly 6% of all retail sales, a number which is expected to grow to 10% by 2025.
-
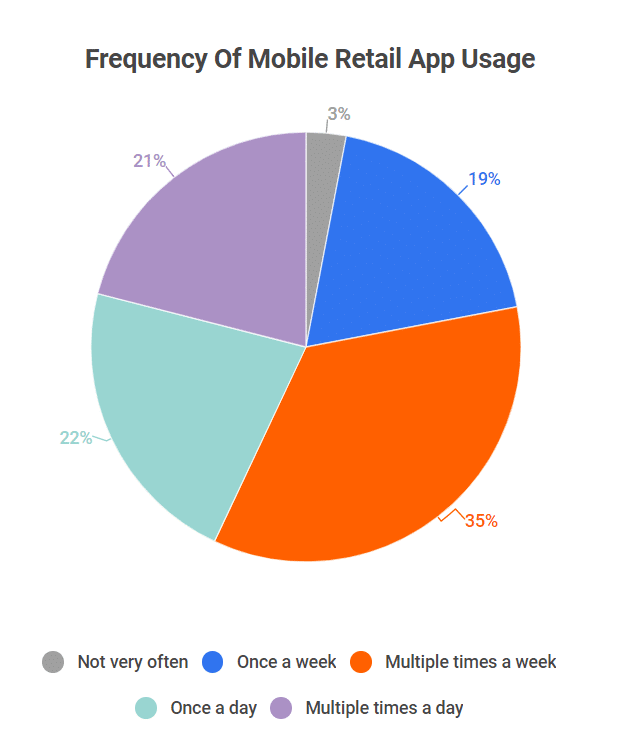
35% of mobile shoppers say the use a mobile retail app multiple times a week. Additionally 22% of shoppers say they use a mobile retail app at least once a day, while 21% say they use one multiple times a day.
Frequency Of Mobile Retail App Usage
Frequency Percent of mobile shoppers Not very often 3% Once a week 19% Multiple times a week 35% Once a day 22% Multiple times a day 21%
Mobile Shopper Statistics
Of course, mobile shopping wouldn’t be as popular as it is without the preferences of mobile buyers. Understandably, the convenience of m-commerce has made it a favorite among U.S. buyers. Here are the facts:
-
60.9% of the U.S. population are mobile buyers.
That’s 167.8 million mobile shoppers in the U.S., a number that is expected to grow to over 187 million by 2024. Even if some of these shoppers aren’t adults, that’s still a significant majority of the U.S. population.
-
Compared to desktops, mobile devices have a 49.8% market share over digital purchases.
Smartphones comprise 46.5% of the market, while tablets only 3.25%. The other 50.2% of the market comes from desktop purchases. This is a significant increase from 2016 when mobile only had a 31.2% market share.
-
55% of buyers make a purchase on their phone after seeing a product on social media.
In fact, research shows that retailers with a social media presence earn 32% more sales than their competitors who lack it. Further, up to 90% of people will purchase from brands they follow on social media.
-
At least 60% of consumers use social media to research new products and services.
In general, social media has huge sway over mobile buyers, with 49% of consumers saying they depend on social media recommendations. As of 2021, the reality is that social media influences 71% of consumer buying decisions.
-
40% of Cyber Monday sales come from mobile devices.
In total, Cyber Monday shoppers spent nearly $10.7 billion in 2021. While 40% is a considerable amount, the other 60% generally comes from desktop purchases.
M-Commerce Optimization Statistics
For companies and marketers to take full advantage of m-commerce, optimization is vital. Here are some facts about m-commerce optimization, according to our extensive research:
-
Mobile devices account for 65% of all e-commerce traffic.
While this is the majority, it’s worth noting that desktop traffic results in more sales. Traffic between mobile and desktop is 65/35, but sales between the two are split at 53/47.
-
Mobile shoppers account for 61% of organic search engine visits.
Which is the vast majority of the 43% of total e-commerce traffic that comes from search engines. This highlights how important SEO optimization is for marketers and businesses.
-
88% of mobile shoppers have had at least one negative experience while shopping.
Most of these issues fall under the following categories: navigation (51%), small images (46%), security concerns (41%), and the checkout process (26%). These experiences resulted in 36% of customers abandoning their carts.
-
33% of mobile shoppers who have a negative experience will immediately switch to a competitor.
What’s more, is that a good portion of users would not want to return to the site that gave them one negative experience. 30% said they would never return, and 29% said it would be at least six months before they returned.
Mobile Commerce Trends and Projections
While it’s already been shown that m-commerce is trending upward, it can’t be understated just how important mobile devices have become in the e-commerce market. Here are the facts about m-commerce trends and predictions:
-
From 2016-2021, global m-commerce sales have grown from just under a trillion to $3.56 trillion.
With year-on-year growth rates between 20-30%, m-commerce has grown exponentially within the last five years. Overall, total growth within the past five years has been just over 73%.
-
From 2017-2021, the share of U.S. m-commerce sales in e-commerce rose from 35.5% to 53.9%.
In less than five years, the share of m-commerce sales increased from only 1/3 of the e-commerce market to just over half. That means half of everything purchased on the web, from Amazon to Google, is done via mobile device.
-
By 2025, m-commerce is expected to make up 10.4% of total retail sales in the U.S.
A large growth projection, seeing as m-commerce only made up 3.5% of retail sales in 2018. However, even as of 2021, that percentage has already nearly doubled to 6%.
-
The number of mobile shoppers in the U.S. is expected to reach 187 million by 2024.
Currently, that number is 167.8 million mobile shoppers, meaning that within the next three years, the number of U.S. mobile shoppers is expected to increase by at least 11%, despite only a 0.4% average annual increase in the population.
-
U.S. m-commerce is expected to experience a massive CAGR of 34.9% between 2020–2026.
By all accounts, we can expect m-commerce to continue trending upward within the next five years. From the number of buyers to m-commerce’s share of e-commerce or retail sales, more and more people are choosing to buy with their mobile devices over other purchasing mediums.
Mobile Commerce FAQ
-
What percentage of e-commerce is mobile?
73% of the e-commerce market is mobile. By the end of 2021, the m-commerce market share will comprise nearly 73% of total e-commerce. Plus, approximately 53.9% of all e-commerce sales are mobile sales.
These are all significant increases from just a few years ago, with the 73% market share being a 39.1% increase from 2016 when m-commerce was only 52.4% of the e-commerce market. Further, in less than five years, the share of m-commerce sales increased from being only 1/3 of the e-commerce market to just over half.
-
How many people use mobile commerce in the U.S.?
60.9% of the U.S. population are mobile buyers. In numbers, there are 167.8 million mobile shoppers in the U.S., a number which is expected to grow to over 187 million by 2024. That means that within the next three years, the number of U.S. mobile shoppers is expected to increase by at least 11%, despite only a 0.4% average annual increase in the population.
-
How big is the U.S. mobile commerce market?
The mobile commerce market continues to get larger and larger in the U.S. As of 2021, m-commerce sales account for 6% of the total retail market. That’s nearly double what the numbers were in 2016. Plus, the market is expected to comprise over 10% of sales by 2025.
In the U.S. alone, revenue generated by m-commerce amounted to $431 billion in 2022. That means that the U.S. market is responsible for around 11-12% of the world’s total m-commerce revenues.
-
How fast is mobile commerce growing?
The e-commerce market is growing fast. Between 2020-2026, U.S. m-commerce is expected to experience a massive CAGR of 34.9%.
Globally, From 2016-2021, m-commerce sales have grown from just under a trillion to $3.56 trillion. And, with year-on-year growth rates between 20-30%, m-commerce has grown exponentially within the last five years. Overall, total growth within the past five years has been just over 73%.
Conclusion
M-commerce is a popular purchasing option for consumers and a valuable tool for marketers. As of 2021, 60.9% of the U.S. population are mobile buyers, while 79% of smartphone owners use their mobile devices to make a purchase.
No wonder marketers want to tap into the mobile market.
The combination of technology, demand, and clever marketing has caused the m-commerce market to grow rapidly in the past five years. From 2017-2021, the share of U.S. m-commerce sales in e-commerce rose from 35.5% to 53.9%.
And, this trend is only expected to continue going forward, with the number of mobile shoppers in the U.S. expected to increase from 167.8 million to 187 million by 2024. Plus, the U.S. m-commerce is expected to experience a massive CAGR of 34.9% between 2020–2026.
Knowing all that, now is a great time to get involved in the m-commerce market. With the right optimization, marketers can turn m-commerce into an even more lucrative market.
Sources:
-
Oberlo. “Mobile Commerce Sales in 2021.” Accessed on December 21st, 2021.
-
Statista. “Mobile retail e-commerce sales worldwide from 2016 to 2021.” Accessed on December 21st, 2021.
-
Statista. “Mobile commerce sales as percentage of total retail sales in the United States from 2018 to 2025.” Accessed on December 21st, 2021.
-
Statista. “Number of mobile buyers in the United States from 2020 to 2024.” Accessed on December 21st, 2021.
-
Statcounter. “Desktop vs Mobile vs Tablet Market Share United States Of America.” Accessed on December 22nd, 2021.
-
MarketingDive. “90% of people buy from brands they follow on social media, study says.” Accessed on December 22nd, 2021.
-
DigitalTransactions. “In Cyber Monday’s Shopping Frenzy, Smart Phones Cooled off While BNPL Took off.” Accessed on December 22nd, 2021.
-
The Drum. “Mobile accounts for 65% of all ecommerce traffic – so why are mobile sales still lagging?” Accessed on December 22nd, 2021.
-
Statista. “Mobile share of organic search engine visits in the United States from 3rd quarter 2013 to 2nd quarter 2021.” Accessed on December 22nd, 2021.
-
Keepitusable. “88% of mobile shoppers have negative user experiences.” Accessed on December 22nd, 2021.
-
Appinventiv. “Future of Mobile Commerce: Stats & Trends to Know in 2021-2025.” Accessed on December 23rd, 2021.
-
GlobalNewswire. “Global M-Commerce Market Size Will Reach USD 3,901 Million by 2026: Facts & Factors.” Accessed on December 23rd, 2021.
-
Statisa “Frequency of mobile retail app usage according to smartphone shoppers in the United States as of April 2020.” Accessed on February 27th, 2023.
- Tech Industry Statistics
- MFA Statistics
- Streaming Services Statistics
- Mobile Vs. Desktop Usage Statistics
- AI Statistics
- Live Streaming Statistics
- Zoom Meeting Statistics
- Cord Cutting Statistics
- Digital Transformation Statistics
- Virtual Reality Statistics
- How Fast Is Technology Advancing
- Mobile Commerce Statistics
- SaaS Statistics
- Machine Learning Statistics
- Diversity In High Tech
- Cyber Security Statistics
- Ecommerce Statistics
- Tech Industry
- Gaming Industry
- Renewable Energy Job Creation
- Smartphone Industry
- Cybercrime Statistics
- Amazon Statistics
- Personalization Statistics
Author
Jack Flynn is a writer for Zippia. In his professional career he’s written over 100 research papers, articles and blog posts. Some of his most popular published works include his writing about economic terms and research into job classifications. Jack received his BS from Hampshire College.