- Tech Industry Statistics
- MFA Statistics
- Streaming Services Statistics
- Mobile Vs. Desktop Usage Statistics
- AI Statistics
- Live Streaming Statistics
- Zoom Meeting Statistics
- Cord Cutting Statistics
- Digital Transformation Statistics
- Virtual Reality Statistics
- How Fast Is Technology Advancing
- Mobile Commerce Statistics
- SaaS Statistics
- Machine Learning Statistics
- Diversity In High Tech
- Cyber Security Statistics
- Ecommerce Statistics
- Tech Industry
- Gaming Industry
- Renewable Energy Job Creation
- Smartphone Industry
- Cybercrime Statistics
- Amazon Statistics
- Personalization Statistics
Research Summary. Like a modern twist on TV that offers more variety and personalization, live streaming has become increasingly popular. Live streaming has become a part of our everyday lives, from simple entertainment to news, meetings, and more. Overall, our extensive research shows that:
-
80% of live stream viewers prefer to watch a stream rather than read content.
-
The live streaming industry’s market value (revenue) reached $59.14 billion as of 2021.
-
By 2028, the global live streaming industry is expected to reach $223.98 billion.
-
Live streaming accounts for 17% of all internet traffic.
-
Globally, live streaming accounts for 23% of total viewing time.
For further analysis, we broke down the data in the following ways:
Business | Age | On-Demand | Trends and Projections
General Live Streaming Statistics
As technology becomes more advanced and integrated with our daily lives, the way we consume video content has changed. Today, live streaming accounts for nearly a fifth of all internet traffic. Here are the facts about live streaming in the U.S. and across the world:
-
Live content generates 27% more watch time per viewing than on-demand content.
That means that if on-demand content were watched for 50 minutes, the same live-stream content would get just over an hour of watch time. That means that live streaming is a more effective method of retaining attention.
-
67% of live video viewers are more likely to buy a ticket to a concert after a live video event.
For example, from 2015 to 2016 alone, the Pickathon music festival’s choice to implement live streaming caused its digital audience to grow from a meager 11,000 to a considerable 200,000. That’s almost 20x the audience.
-
67% of viewers say video quality is the #1 factor when watching a Livestream.
And quality can also pertain to buffering and other issues, as for every additional second of start-up time beyond 2 seconds, 6% more viewers will disengage from the stream.
-
As of 2022, Twitch is the largest live streaming platform with over 2.9 billion average concurrent viewers.
Following Twitch, other top live streaming platforms include YouTube Live, Facebook Live, and Caffeine. Periscope was also a major player but was shut down by Twitter in 2021.

Live Streaming In Business Statistics
If you’re a marketer looking to reach customers more effectively, it’s important to understand the growth of live streaming. Is live streaming a good business tool? Well, our research shows that:
-
79% of marketers agree that a more authentic interaction is a top benefit of live video.
Other benefits reported by marketers include: bringing a human element to digital marketing (63%), creating content that can be viewed or re-purposed later (61%), and making discoveries through audience feedback (60%).
-
Livestreams get 10% more engagement on average than pre-recorded content.
A large percentage of this increased engagement comes from video comments, which make up around 25% of interactions. These comments then allow marketers to extrapolate valuable feedback.
-
As of 2021, 28% of marketers are beginning to invest more into live streaming.
This is for several reasons, but the most important are that consumers are 39% more likely to share video content, and 45% say they would pay for exclusive, live videos from their favorite brands/creators.
Live Streaming Statistics By Age
While live streaming is becoming more widely used overall, it’s especially popular with younger generations. This trend is true for news, gaming, and more. According to our research:
-
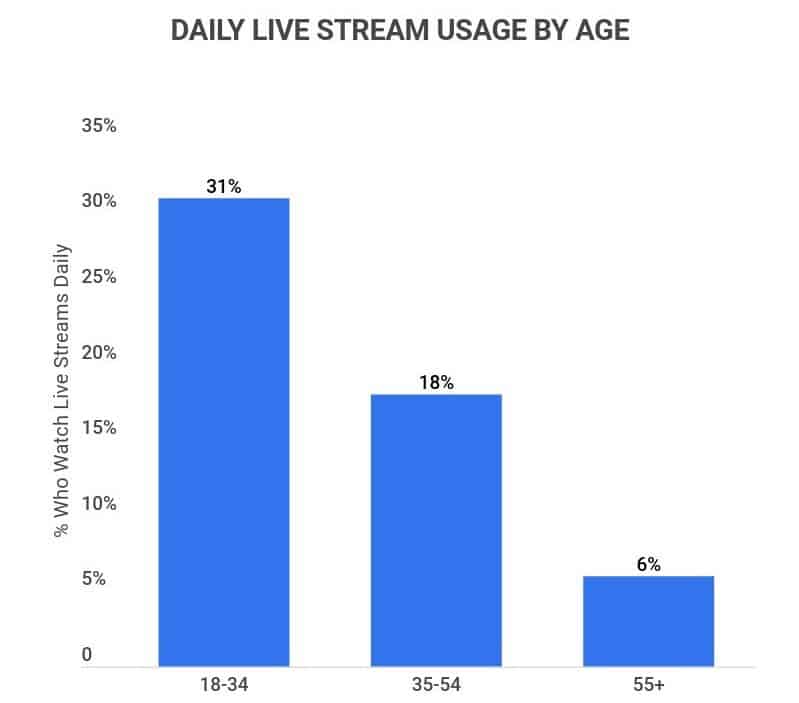
31% of those between 18-34 watch live streams daily.
That number is further divided by 16% who watch live streams once per day and 15% watching several times per day. That’s far more than any other age group, with only 18% of those between 35-54 and 6% of those 55+ doing the same.
-
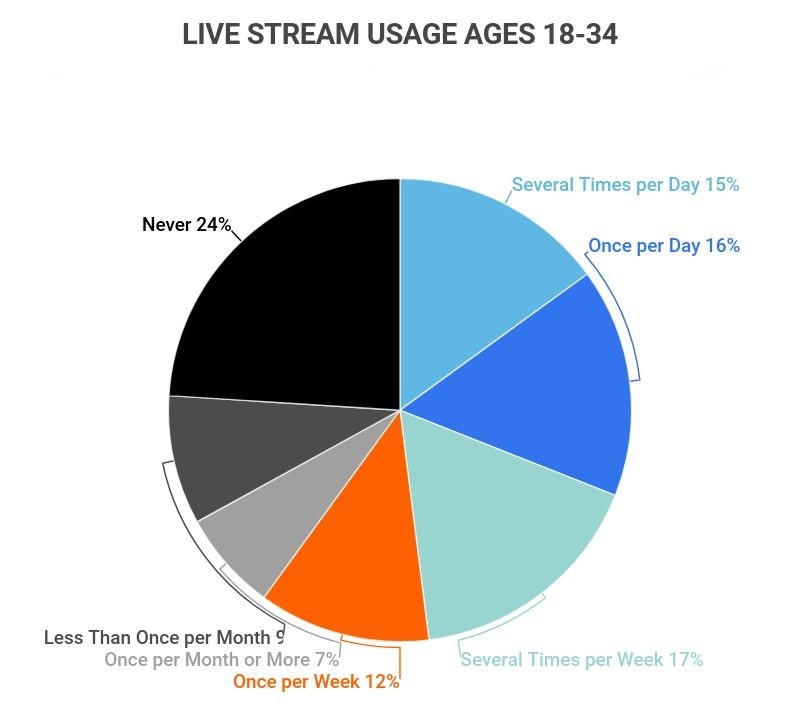
62% of those 55+ never watch live streams.
On the other hand, the percentage of those between 35-54 who never watch live streams is 45%, and for those between 18-34, it’s only 24%.
-
Over 3x the percentage of those 18-34 watch live streams once a week or more when compared to those 55+.
60% of those between 18-34 watch live streams once a week or more compared to only 18% of those 55+. The percentage for those 18-34 is also higher than those between the ages of 35-54, as only 37% of those in that age demographic watch streams once a week or more.
-
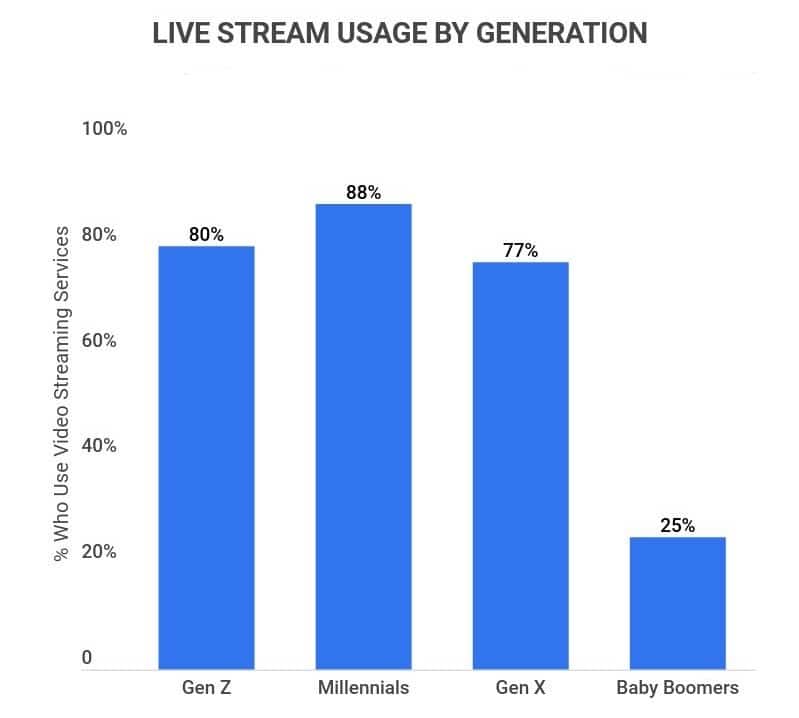
Millennials use live streaming the most, with 88% of the generation using video streaming services.
This is then followed by Gen Z (80%), Gen X (77%), and Baby Boomers (25%). The percentage drops off drastically because many Baby Boomers still prefer cable TV.
Live Streaming Frequency by Age
| Frequency (% Of Pop.) | Ages 18-34 | Ages 35-54 | Ages 55+ |
|---|---|---|---|
| Several Times per Day | 15% | 8% | 3% |
| Once per Day | 16% | 10% | 3% |
| Several Times per Week | 17% | 12% | 6% |
| Once per Week | 12% | 7% | 6% |
| Once per Month or More | 7% | 6% | 5% |
| Less Than Once per Month | 9% | 12% | 16% |
| Never | 24% | 45% | 62% |
On-Demand Streaming Statistics
Since the invention of Netflix, on-demand streaming services have also become popular. We have even more options today, from Hulu to Amazon Prime Video. Here are some facts about on-demand streaming services in the U.S.:
-
In the U.S., streaming now accounts for 26% of all time spent on TV.
While cable TV still accounts for 64% of the time Americans spend watching, a full quarter is still a large percentage. That’s especially true, given that Netflix didn’t start streaming until 2007.
-
78% of Americans as now subscribed to at least one of the major streaming services.
That includes either Netflix, Hulu, or Amazon Prime Video. Further, 55% of American households use at least two streaming services.
-
40% of American adults now use streaming services at least once per day.
The most prominent age group of users is those between 18 and 44, 63% of whom watch videos on streaming services once per day.
-
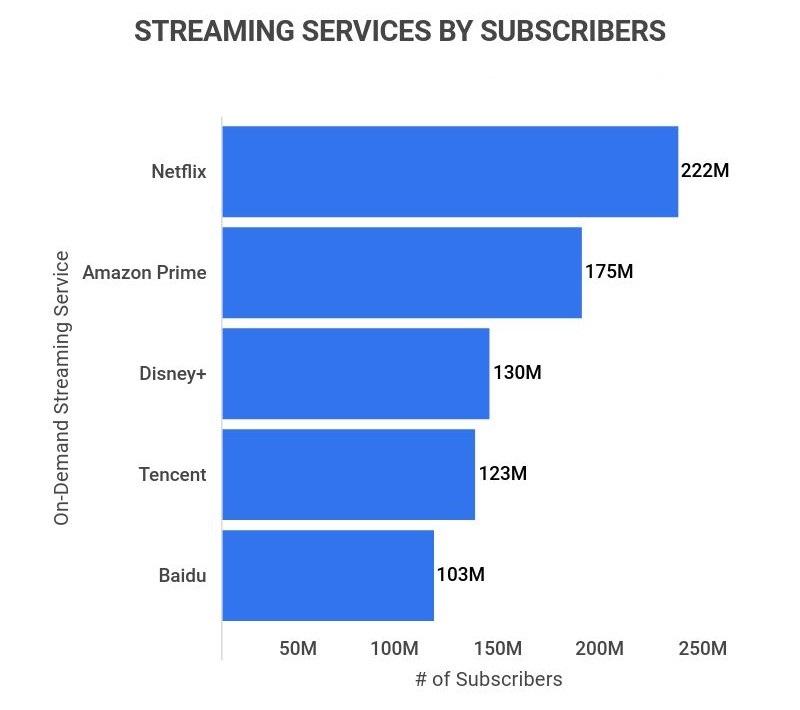
Netflix is the largest on-demand streaming service, with at least 221.8 million subscribers.
This is then followed by Amazon Prime Video (175 million), Disney+ (129.8 million), Tencent (123 million), and Baidu (103.6 million).
Live Streaming Trends and Projections
From its original rise to popularity in the 2010s to today, live streaming has become a major source of entertainment for many. From vlogs to gaming, here are some facts about live streaming trends and predictions:
-
From 2020 and 2021, Twitch’s viewership has grown by 45%.
Gaming is an especially popular genre of live streaming, with the most popular games streamed on Twitch being Grand Theft Auto 5 (175%), League of Legends (28%), and Fortnite (10.6%). Facebook Gaming’s viewership also grew by 47% last year.
-
From 2019 and 2020, the online live streaming industry grew by 99%.
Likely due to the COVID-19 pandemic, live streaming rose drastically in popularity during this time. Factors like a shift to remote work, layoffs, and more can all be attributed to this increase.
-
Live stream sports events are most popular in China, where 54% of fans watch them.
On the other hand, only 17% of U.S. sports fans watch live stream sports events, less than half that of Chinese sports fans. Other countries where live streamed sports events have become popular include Indonesia (50%) and Taiwan (49%).
-
From 2011 to 2017, the percentage of sporting events live-streamed in the U.S. nearly doubled.
In 2011 only 48% of U.S. sporting events were live-streamed. However, that grew to 86% in 2017 and continues to grow today. Though American sports viewers gravitate toward streaming less than those in other countries, live-stream sporting events are still growing in popularity.
-
Between 2021 and 2028, the live streaming industry is expected to experience a CAGR of 21%.
That would mean an increase from the current market size of $59.14 billion to a whopping $223.98 billion in 2028.
Top Countries for Live Streaming Sports Events
| Country | % Of Fans Who Watch Live Streams | % Of Fans Who Watch Cable Tv |
|---|---|---|
| China | 54% | 66% |
| Indonesia | 50% | 73% |
| Taiwan | 49% | 60% |
| Philippines | 42% | 59% |
| UAE | 42% | 54% |
| Peru | 42% | 84% |
| Argentina | 42% | 75% |
| Egypt | 42% | 63% |
| India | 41% | 66% |
| Saudi Arabia | 41% | 64% |
| Thailand | 41% | 59% |
| Chile | 40% | 72% |
| South Korea | 39% | 56% |
| Colombia | 38% | 81% |
| Malaysia | 38% | 60% |
| Brazil | 38% | 78% |
| Mexico | 38% | 61% |
| Vietnam | 37% | 71% |
| Hong Kong | 35% | 53% |
| Singapore | 29% | 36% |
| Spain | 28% | 68% |
| Australia | 27% | 62% |
| Italy | 25% | 67% |
| UK | 24% | 55% |
| Canada | 23% | 60% |
| Finland | 22% | 68% |
| Sweden | 21% | 49% |
| Denmark | 20% | 63% |
| Germany | 19% | 58% |
| USA | 17% | 53% |
| France | 16% | 74% |
| Japan | 13% | 63% |
Live Streaming Statistics FAQ
-
How many people watched live streams in 2021?
While it’s unclear just how many people watched live streams in 2021, estimates are well in the millions. A more accurate way to measure the popularity of live streams is watch time, and in 2021 global engagement reached 550 billion hours. That’s up 14% from 2020 when watch time was 480 billion hours.
Percentage-wise, 60% of those between 18-34 now watch live streams once a week.
-
How many viewers does the average Twitch streamer have?
The average Twitch streamer only has 27.7 viewers per stream. That might seem surprisingly low, but the sheer volume of streamers on Twitch means that the vast majority do not receive many views.
For context, Twitch’s largest streamer, Ninja, receives an average of 15,444 viewers. The content creator has also been watched for over 3.7 million hours. With that in mind, there is a huge divide on Twitch between popular streamers and new or less well-known ones.
-
Everyone from almost every country watches live streaming. However, there are some demographics where watching live streams is more common.
For instance, 3x the percentage of those 18-34 watch live streams once a week or more when compared to those 55+. 60% of those between 18-34 watch live streams once a week or more compared to only 18% of those 55+.
In the context of countries, the U.S. is actually far behind others when it comes to watching events via live stream. Live stream sports events are most popular in China, where 54% of fans watch them. On the other hand, only 17% of U.S. sports fans watch live stream sports events, less than half that of the Chinese sports fans.
-
What are the most viewers on a live stream?
The live stream with the most views (to date) is Felix Baumgartner’s space jump, streamed on Youtube. The live stream reached a peak viewership of 8 million. That’s equivalent to nearly the entire population of Switzerland watching all at once.
On Twitch, the most viewed ever made was by TheGrefg (David Cánovas Martínez) on January 11, 2021. This particular stream hit 2.47 million viewers during its run time.
Conclusion
From that sunny day in 2007 when we ordered our first Netflix DVD to today, live streaming and streaming services have gone from non-existent to a staple of everyday media. Today, the live streaming industry’s market value (revenue) reached $59.14 billion. And, with a predicted CAGR of 21% through 2028, that number is only expected to grow.
In fact, given live streaming accounts for 17% of all internet traffic, and 78% of Americans as now subscribed to at least one of the major streaming services, it’s very safe to assume that live streaming may come to rival cable TV here in the U.S. After all, it already has in countries like China, Indonesia, and Taiwan.
Overall, all signs point to a vast future of live streaming ahead.
Sources:
-
Grand View Research. “Video Streaming Market Size & Share Report, 2021-2028.” Accessed on February 28th, 2022.
-
Live Revolution. “Immersive Interactive Streaming for Live Events.” Accessed on February 28th, 2022.
-
TwitchTracker. “Twitch Statistics & Charts.” Accessed on February 28th, 2022.
-
Streamer. “The Big Live Streaming Platforms.” Accessed on February 28th, 2022.
-
Marketing Charts. “Top 5 Perceived Benefits of Live Streaming Video Events.” Accessed on February 28th, 2022.
-
Crowdfire. “How to Boost Your Live Streaming Engagement.” Accessed on February 28th, 2022.
-
Arena. “How to Increase Traffic and Engagement with Live Stream.” Accessed on February 28th, 2022.
-
Statista. “Frequency of watching livestream video in the United States as of July 2020, by age group.” Accessed on February 28th, 2022.
-
DataTrek. “Millennial Video Content Consumption Stats.” Accessed on February 28th, 2022.
-
TheGamer. “Twitch Sees A 45 Percent Viewership Increase In 2021.” Accessed on March 1st, 2022.
-
YouGovSport. “The rise of sports streaming: Where is it most popular?” Accessed on March 1st, 2022.
-
CNBC. “About one-quarter of U.S. TV time is spent watching streaming services, says Nielsen.” Accessed on March 1st, 2022.
-
The National Interest. “Majority of U.S. Households Have at Least Two Streaming Services.” Accessed on March 1st, 2022.
-
Fierce Video. “Over three-quarters of U.S. households subscribe to a streaming service.” Accessed on March 1st, 2022.
- Tech Industry Statistics
- MFA Statistics
- Streaming Services Statistics
- Mobile Vs. Desktop Usage Statistics
- AI Statistics
- Live Streaming Statistics
- Zoom Meeting Statistics
- Cord Cutting Statistics
- Digital Transformation Statistics
- Virtual Reality Statistics
- How Fast Is Technology Advancing
- Mobile Commerce Statistics
- SaaS Statistics
- Machine Learning Statistics
- Diversity In High Tech
- Cyber Security Statistics
- Ecommerce Statistics
- Tech Industry
- Gaming Industry
- Renewable Energy Job Creation
- Smartphone Industry
- Cybercrime Statistics
- Amazon Statistics
- Personalization Statistics
Author
Jack Flynn is a writer for Zippia. In his professional career he’s written over 100 research papers, articles and blog posts. Some of his most popular published works include his writing about economic terms and research into job classifications. Jack received his BS from Hampshire College.