- Workplace Statistics
- Time Management Statistics
- Employee Wellness Statistics
- Employment Discrimination Statistics
- Employee Recognition Statistics
- Employee Referral Statistics
- Workplace Violence Statistics
- Gamification Statistics
- Employee Feedback Statistics
- Agile Statistics
- Productivity Statistics
- Meeting Statistics
- Cell Phones At Work Statistics
- Social Media At Work Statistics
- Workplace Injury Statistics
- Workplace Stress Statistics
- Leadership Statistics
- Workplace Collaboration Statistics
- Job Satisfaction Statistics
- Paid Holiday Statistics
- Communication In The Workplace Statistics
- Wasting Time At Work Statistics
- 4-day Workweek Statistics
Research Summary. From harassment to receiving less pay, marginalized groups still face discrimination in the workplace regularly. However, over time these practices have become less acceptable and more punishable. Now, it’s possible to take legal action over workplace discrimination. Our extensive research shows that:
-
The EEOC reported that there were 61,331 charges of discrimination filed in 2021.
-
Only 17.4% of the EEOC’s closed workplace discrimination cases result in success for the client.
-
Racial discrimination claims have the lowest success rate, at only 15%.
-
Retaliation is the most common discrimination claim, accounting for 56% of all claims.
-
There have been over 1.8 million complaints filed with the EEOC since 1997.
-
In 2021, employers paid out roughly $484 million in settlements to discrimination victims.
For further analysis, we broke down the data in the following ways:
Type of Discrimination | Worker Experience | Success Rate of Complaints | Region | Trends and Projections | Demographics
Employment Discrimination Statistics By Type of Discrimination
Of course, workers can be discriminated against for a variety of reasons. Claims and cases can range from age to race to anything in-between. In general, when it comes to different types of discrimination, our research shows that:
-
Retaliation is the most common discrimination claim, with 34,332 charges filed in 2021.
Retaliation is the most common type of discrimination in the workplace, taking the form of employees being punished by an employer for engaging in legally protected activity.
For instance, if an employee participates in a lawful workplace investigation and their employer demotes them or fires them, that would be considered retaliation.
The second and third most common discrimination claims are disability claims with 22,843 charges filed and race claims with 20,908 charges filed.
-
Genetic information claims are the least common, with only 242 charges filed in 2021.
This type of discrimination occurs when employees are mistreated by their employer because they have a gene mutation that can cause or increase the risk of an inherited disorder. Often, this discrimination is caused by employers not wanting to deal with the risk associated with providing the employee with adequate health insurance.
The second and third least common discrimination claims are equal pay act claims with 885 charges filed and religion claims with 2,111 charges filed.
-
Discrimination based on retaliation, disability, race, or sex approximates more than 30% of all charges.
Retaliation is the most prevalent, making up 56% of all charges. However, the other three are also common, with disability at 37.2%, race at 34.1%, and sex at 30.6%.
-
Discrimination based on equal pay makes up only 1.4% of charges filed.
Despite equal pay being discussed as a prevalent issue, the number of charges filed makes up only a tiny percentage of the whole. This could be partly attributed to employers not having candid or open policies about employees sharing information about their salaries.
U.S. Discrimination Claims by Type 2020-2021
| Type Of Discrimination Charge | # of Charges Filed (2021) | # of Charges Filed (2020) | % of All Charges Filed (2021) | % of All Charges Filed (2020) |
|---|---|---|---|---|
| Retaliation | 34,332 | 37,632 | 56.0% | 55.8% |
| Disability | 22,843 | 24,324 | 37.2% | 36.1% |
| Race | 20,908 | 22,064 | 34.1% | 32.7% |
| Sex | 18,762 | 21,398 | 30.6% | 31.7% |
| Age | 12,965 | 14,183 | 21.1% | 21.0% |
| National Origin | 6,213 | 6,377 | 10.1% | 9.5% |
| Color | 3,516 | 3,562 | 5.7% | 5.3% |
| Religion | 2,111 | 2,404 | 3.4% | 3.6% |
| Equal Pay Act | 885 | 980 | 1.4% | 1.5% |
| Genetic Information | 242 | 440 | 0.4% | 0.7% |
Employment Discrimination Statistics By Worker Experience
While much workplace discrimination occurs behind closed doors, a surprising number of employees have witnessed it first-hand. When these employees don’t report what they’ve seen, it can severely damage the employee being discriminated against and the overall workplace culture. Here are the facts:
-
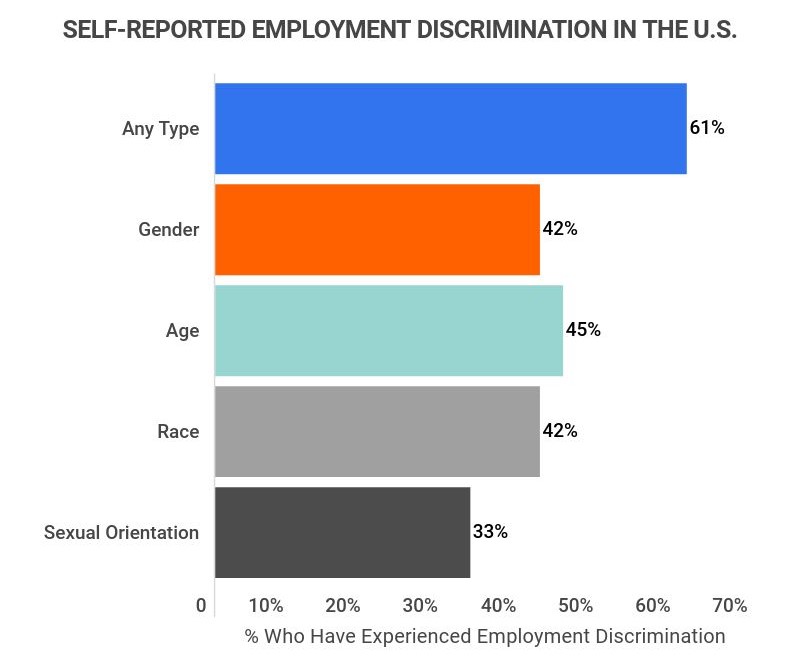
In the United States, 61% of employees have experienced or witnessed workplace discrimination.
That’s notably higher than some other countries, including France and Germany, where only 43% and 37% of workers have experienced workplace discrimination.
-
45% of Americans have experienced Age discrimination, making it the most commonly experienced form of discrimination in the U.S.
In general, younger employees find that older, more experienced workers discriminate against them, and elderly employees are also discriminated against. This can come in the form of harassment toward younger workers or not providing opportunities for older workers.
Of course, it’s worth noting that other forms of discrimination are also common. 42% of Americans also report that they’ve experienced discrimination based on their race or gender.
-
33% of Americans have experienced discrimination based on their sexual orientation.
While this is a lesser percentage than those who have experienced discrimination based on their age, sex or race, it’s also worth pointing out that only around 7% of Americans identify as LGBTQ+, meaning that the number of people discriminated against based on sexual orientation could be more alarmingly high than it seems.
Employment Discrimination Statistics By Success Rate of Complaints
Unfortunately, the success rates for employee discrimination complaints and cases are low in the United States. Many complaints are settled out of court, and many are never turned into formal charges. According to our research:
-
Only 17.4% of the EEOC’s closed workplace discrimination charges result in a resolution for a client.
When you consider that only 15% of complaints become formal lawsuits, the number of people receiving justice is concerningly low. The only silver lining is that 2020 was an improvement over 2019 when only 15.6% of cases resulted in a resolution for clients.
-
The average workplace discrimination settlement amount is $40,000.
However, this can vary drastically depending on the size of the employer. For instance, the court can award up to $50,000 to an employee if the employer has between 15 and 100 employees, $100,000 (101 to 200 employees), $200,000 (201 to 500 employees), and a whopping $300,000 the employer has 500+ employees.
-
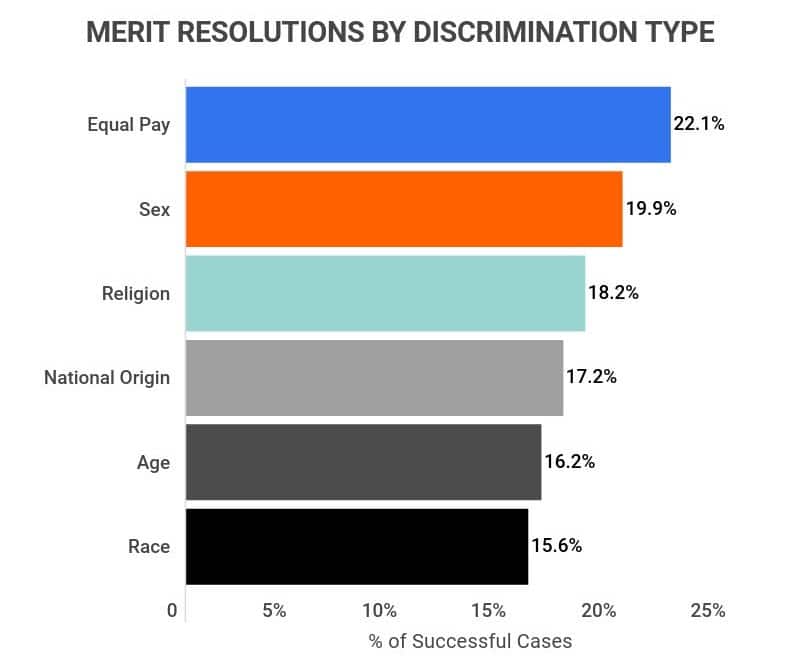
22.1% of equal pay charges that result in a resolution, a higher rate than any other type of discrimination case filed.
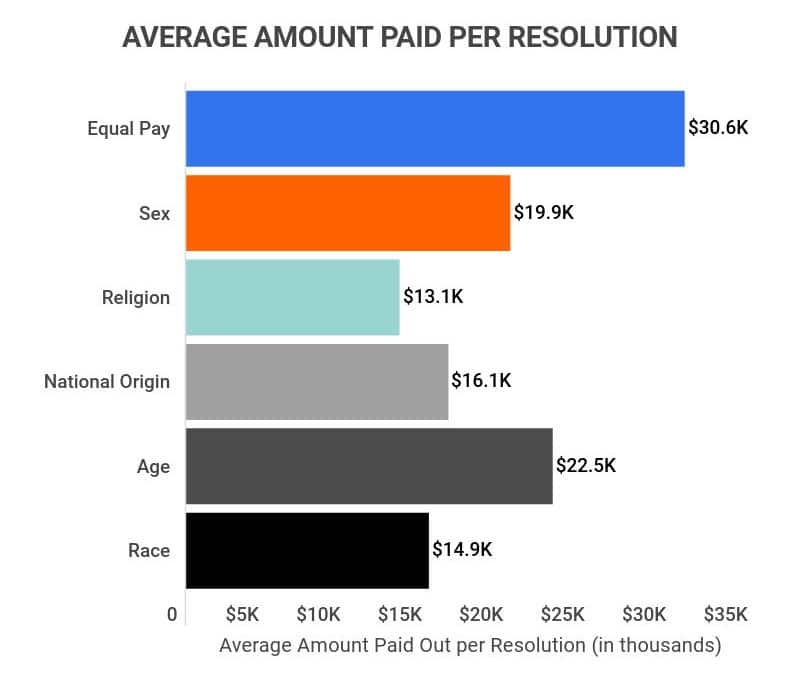
With the average payout being $30,600, equal pay charges are the most successful of any discrimination case. The runner-up is sex discrimination charges, which have a 19.9% success rate, but a much lower average payout of only $19,900.
-
Discrimination based on sex has had the highest number of resolutions since 1997 at 123,665.
Despite the payouts for these charges being lower than those for equal pay, sex-related charges are far more common. Race discrimination charges have also had many resolutions, at 118,870.
-
Religious discrimination charges have the lowest average payout, at only $13,100.
That’s 43% less money than the average equal pay case payout. Other lower-paid case types include race discrimination charges, with an average payout of $14,900, and national origin charges, with an average payout of $16,100.
-
The EEOC resolved 165 merits lawsuits and filed 93 discrimination allegations in 2020.
Though this process did secure a total of $106 million for victims, it’s only a fraction of the number of claims and calls the EEOC deals with regularly. For example, the agency responded to over 470,000 calls to its toll-free number related to discrimination.
>
Employment Discrimination Statistics By Region
The U.S. is a huge country, which means employees can face more or less discrimination depending on where they live. Unfortunately, certain areas have histories that can exacerbate certain forms of discrimination. With that in mind, here are some facts about employment discrimination by region:
-
Alabama has the highest rate of discrimination in the U.S., with 62.2 complaints per 100,000 people.
Other states with high rates of discrimination include Mississippi (60.8), Arkansas (51.7), and Georgia (50.3). All of which are right next to each other on the map, making this a regional issue beyond state lines.
-
Maine has the lowest rate of discrimination in the U.S., with 2.5 complaints per 100,000 people.
That’s 25x fewer people filing discrimination complaints than Alabama. Other states with low rates of discrimination include Montana (2.6), New Hampshire (4.0), Idaho (4.3), and Nebraska (4.3). These states are all over the map but share a low population density in most areas.
-
New Mexico has the most discrimination complaints filed based on National Origin, at 5 for every 100,000 people.
Though this number is higher than any other state, discrimination cases based on national origin in New Mexico have actually decreased by -68.9% between 2009-2018.
The states with the second and third highest complaints are Colorado (3.1) and Florida (3.1). A majority of the time, immigrants receive the brunt of this discrimination.
-
From 2009 to 2018, the equal pay discrimination cases in Michigan increased by 163.6%.
The only other state with over a 100% increase was Maryland, with a 123.1% increase. However, the state with the highest decrease in equal pay discrimination cases was New Mexico, which saw cases halved.
-
From 2009 to 2018, the sex discrimination cases in Nebraska increased by 166.7%.
The only other state with over a 100% increase was Massachusetts, with a 108.7% increase. On the other hand, Idaho had the highest decrease in sex discrimination cases at -55.9%.
-
In total, 48 states have equal pay laws in place.
The only states that haven’t drafted or implemented equal pay laws are North Carolina, South Carolina, Utah, and Wisconsin. However, these states have general employment laws prohibiting inequitable wages due to discrimination.
-
Thirty-three states have legal protections in place to protect LGBTQ+ workers.
That leaves only 17 states that still lack these protections. Overall, the south and midwest have fewer legal protections, while the northeast and West coast have the most.
-
Michigan is the only state to outlaw weight discrimination.
Despite obesity rates among adults increasing by 27.5% in the past years, 49 states still have no protections for overweight or obese workers.
Discrimination Cases per Capita by State
| State | # Of Complaints Per 100,000 People |
|---|---|
| Alabama | 62 |
| Mississippi | 60 |
| Arkansas | 51 |
| Georgia | 50 |
| New Mexico | 48 |
| Tennessee | 44 |
| North Carolina | 42 |
| Indiana | 41 |
| Illinois | 39 |
| Louisiana | 39 |
| Maryland | 38 |
| Nevada | 38 |
| Virginia | 35 |
| Florida | 34 |
| Oklahoma | 34 |
| Arizona | 34 |
| Pennsylvania | 33 |
| Colorado | 33 |
| Missouri | 33 |
| Texas | 31 |
| Michigan | 25 |
| Kansas | 25 |
| Ohio | 24 |
| South Carolina | 24 |
| Hawaii | 22 |
| Kentucky | 21 |
| New York | 19 |
| New Jersey | 18 |
| Minnasota | 17 |
| Wisconsin | 17 |
| Delaware | 17 |
| Washington | 16 |
| California | 16 |
| Alaska | 12 |
| Wyoming | 9 |
| North Dakota | 8 |
| West Virginia | 7 |
| Utah | 7 |
| Connecticut | 7 |
| South Dakota | 6 |
| Massachusetts | 6 |
| Oregon | 5 |
| Iowa | 5 |
| Rhode Island | 5 |
| Vermont | 5 |
| Nebraska | 4 |
| Idaho | 4 |
| New Hampshire | 4 |
| Montana | 2 |
| Maine | 2 |
Employment Discrimination Statistics By Trends and Projections
While it is true that discrimination complaints in the U.S. are decreasing over time, the U.S. still has a long way to go. To understand exactly where the country is headed, we’ve gathered some interesting facts about employment discrimination trends and projections:
-
The EEOC reported that there were 67,448 charges of discrimination filed in 2020.
Overall, there has been a downward trend in the number of discrimination charges filed. In 2019 there were 72,675 charges, and in 2018 there were 76,418. That’s an average decrease of 3,000-5,000 charges per year.
-
There have been over 1.8 million complaints filed with the EEOC since 1997.
Of the 1.8 million complaints filed, 35.7% were race discrimination (710,512), 28.7% were sex discrimination (570,360), 21.3% were age discrimination (422,866), while the remaining 14.3% was split between national origin (198,689), religion (64,006), and equal pay (22,861) discrimination.
-
Discrimination charges are experiencing a year-over-year decrease of between 5-8%.
Between 2018 and 2019, the number of employment discrimination charges decreased by 5.1%, and between 2019-2020, that decrease rose to 7.75%. Hopefully, these trends indicate progress toward an equitable workplace.
-
Between 2019-2020 the number of discrimination charges related to Genetic Information increased by 133.3%.
Despite only 0.7% of all discrimination charges related to genetic information in 2020, that was still a massive increase from 2019, when these charges only made up 0.3% of all charges.
-
Between 1997-2020 the number of discrimination charges related to Retaliation increased by 146.9%.
Currently, most charges (56%) and retaliation only accounted for 22.6% of all charges in 1997. Since then, charges related to retaliation have continued to increase steadily year by year.
-
Between 1997-2020 the number of discrimination charges related to Race decreased by 9.7%.
Decreasing from 36.2% of charges in 1997 to 32.7% in 2020, race discrimination is one of the few types of discrimination charges that have decreased over the past two decades.
Employment Discrimination Statistics By Demographics
Unfortunately, workers can be discriminated against for almost anything. Whether it’s because they’re female, young, or have a different skin color, here are some of the facts about the demographics of discrimination in the workplace:
-
24% of Black and Hispanic employees report that they’ve felt discriminated against within the past 12 months.
Meanwhile, only 15% of White employees report the same. Overall, 18% of all workers say they’ve been discriminated against within the past 12 months, which means the reports of Black and Hispanic employees put them well above the national average.
-
Of that 24%, 75% of Black employees report being discriminated against due to their race.
The numbers for Hispanic employees are also high, at 61%. Meanwhile, only 42% of White employees report the same. Overall, 52% of the 18% of workers who’ve felt discriminated against say it was because of their race.
-
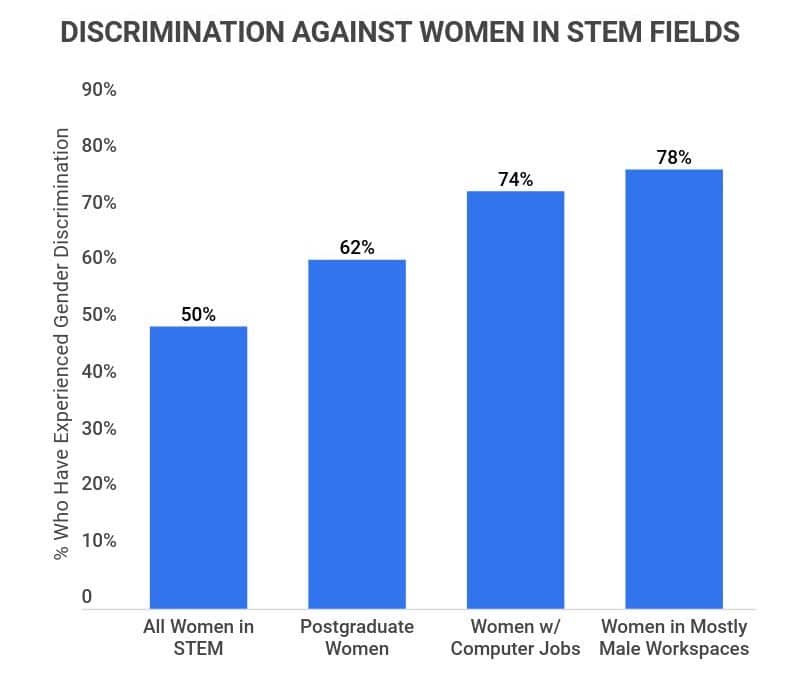
50% of women working in STEM fields report being discriminated against due to their gender.
STEM fields make up 48% of U.S. jobs, but only 27% of those working in them are women. Even worse, postgraduate women experience even more discrimination than their counterparts (likely due to an even greater male presence). In total, 62% of women with postgraduate degrees in the field say they receive unfair treatment.
-
Those between 18-34 are the most likely to experience workplace discrimination, with 52% having experienced it.
Older employees are also more likely to experience discrimination in the workplace, even if not as much. Overall, 33% of those 55+ have experienced workplace discrimination based on their age.
Employment Discrimination Statistics FAQ
-
How many workplace discrimination cases were there in 2021?
The EEOC filed 114 workplace discrimination cases in 2021. That’s a 23.5% decrease from 2019 when 149 cases were filed.
However, it’s important to note that these cases only make up a fraction of the discrimination charges filed. For example, in 2020, the EEOC reported 67,448 charges of discrimination filed, and in 2019 that number was 72,675.
-
What is the most common basis of employment discrimination?
The most common basis of employment discrimination is retaliation. As of 2021, retaliation makes up approximately 56% of all discrimination charges. Further, this is a 146.9% increase from 1997, when retaliation only made up 22.6% of all charges.
Other times of discrimination that account for more than 30% of charges each include discrimination based on disability (36.1%), race (32.7%), and sex (31.7%).
-
Who is affected the most by workplace discrimination?
Minorities are affected most by workplace discrimination. Any worker who’s a different gender, race, etc., from the majority of their co-workers and employers is more likely to face workplace discrimination.
That’s why one-fourth of Black workers, who make up only 12.6% of the workforce, report that they’ve experienced employment discrimination within the past 12 months. Of those workers, 75% say they were discriminated against based on their race.
This same logic can also be applied to female workers in STEM fields. Because only 27% of STEM workers are women, they face discrimination at much higher rates. In fact, 50% of women and 62% of postgraduate women working in STEM fields report being discriminated against due to their gender.
-
What is the average EEOC settlement?
The average EEOC settlement is around $40,000. However, this can vary drastically depending on the size of the employer.
For instance, the court can award up to $50,000 to an employee if the employer has between 15 and 100 employees, $100,000 (101 to 200 employees), $200,000 (201 to 500 employees), and up to $300,000 if the employer has 500+ employees.
-
What are the chances of winning an EEOC case?
95% of EEOC district court cases are successful, though this number can be misleading. The reality is that only 17.4% of the EEOC’s closed workplace discrimination charges result in a resolution for a client. That’s because as little as 2% of charges result in action.
-
How do you prove discrimination in the workplace?
The best way to prove discrimination in the workplace is through direct evidence. Direct evidence involves statements, written documents, or emails that can easily be proven in court.
Unfortunately, most employment discrimination cases rely on circumstantial evidence, where the victim must prove they were discriminated against through inferences.
For example, if a worker feels as though they were fired due to their gender, they would have to prove that was the employer’s intent through an inference such as “the company regularly fires female employees and replaces them with males.”
Of course, this can be hard to prove and easy for employers to dispute, which is why discrimination cases are rarely taken to court.
Conclusion
Within the past few decades, the issue of discrimination has come to light with the introduction of the federal and statewide legislature. Over 1.8 million charges have been filed since 1997, and luckily, each year, the numbers seem to decrease.
However, discrimination remains a major issue for various demographics across multiple regions. Women, POC, LGTBQ+, young and old workers still find that their paychecks, job security, and decency can be put on the line due to discriminatory acts.
Hopefully, the current trends showing increased awareness and decreased case numbers will continue, creating an equal work environment for all.
References
-
JDSUPRA. “EEOC FY 2020 Statistics: EEOC’s Recovery on Behalf of Employees Dramatically Increased, Number of Discrimination Charges at All-Time Low.” Accessed on March 20th, 2022.
-
Outsolve. “EEOC Announces Record Year: Secures $484M for Victims of Discrimination.” Accessed on March 20th, 2022.
-
EEOC. “EEOC Releases Fiscal Year 2020 Enforcement and Litigation Data.” Accessed on March 20th, 2022.
-
Statista. “How Common Is Workplace Discrimination?” Accessed on March 20th, 2022.
-
Smithey Law Group. “What Is the Average Settlement for a Discrimination Lawsuit?” Accessed on March 20th, 2022.
-
Paychex. “Employment and Discrimination: Exploring the Climate of Workplace Discrimination from 1997 to 2018.” Accessed on March 20th, 2022.
-
CNBC. “Studies show weight discrimination permeates the US workplace — but it’s legal in 49 states.” Accessed on March 21st, 2022.
-
EEOC. “Charge Statistics (Charges filed with EEOC) FY 1997 Through FY 2020.” Accessed on March 21st, 2022.
-
Pew Research Center. “Women and Men in STEM Often at Odds Over Workplace Equity.” Accessed on March 21st, 2022.
-
Glassdoor. “Glassdoor Survey Finds Three in Five U.S. Employees Have Experienced or Witnessed Discrimination Based on Age, Race, Gender or LGBTQ Identity at Work.” Accessed on March 21st, 2022.
- Workplace Statistics
- Time Management Statistics
- Employee Wellness Statistics
- Employment Discrimination Statistics
- Employee Recognition Statistics
- Employee Referral Statistics
- Workplace Violence Statistics
- Gamification Statistics
- Employee Feedback Statistics
- Agile Statistics
- Productivity Statistics
- Meeting Statistics
- Cell Phones At Work Statistics
- Social Media At Work Statistics
- Workplace Injury Statistics
- Workplace Stress Statistics
- Leadership Statistics
- Workplace Collaboration Statistics
- Job Satisfaction Statistics
- Paid Holiday Statistics
- Communication In The Workplace Statistics
- Wasting Time At Work Statistics
- 4-day Workweek Statistics
Author
Jack Flynn is a writer for Zippia. In his professional career he’s written over 100 research papers, articles and blog posts. Some of his most popular published works include his writing about economic terms and research into job classifications. Jack received his BS from Hampshire College.