- Tech Industry Statistics
- MFA Statistics
- Streaming Services Statistics
- Mobile Vs. Desktop Usage Statistics
- AI Statistics
- Live Streaming Statistics
- Zoom Meeting Statistics
- Cord Cutting Statistics
- Digital Transformation Statistics
- Virtual Reality Statistics
- How Fast Is Technology Advancing
- Mobile Commerce Statistics
- SaaS Statistics
- Machine Learning Statistics
- Diversity In High Tech
- Cyber Security Statistics
- Ecommerce Statistics
- Tech Industry
- Gaming Industry
- Renewable Energy Job Creation
- Smartphone Industry
- Cybercrime Statistics
- Amazon Statistics
- Personalization Statistics
Research Summary: When you think of a massive robbery, you might picture a gang of hooded criminals invading an important bank before speeding away in their cars. What you might not have thought of is the fact that over $8 trillion was stolen through cybercrime in 2022 alone.
What makes cybercrime so insidious, among other things, is the fact that hackers can easily go undetected when stealing valuable information. And unfortunately, no individual or business is immune.
To find out more about the growing problem of cybercrime, we’ve gathered an extensive list of statistics. According to our extensive research:
-
23% of Americans (nearly one in four) have been the victim of cybercrime.
-
54% of companies have experienced a cyberattack within the past 12 months.
-
The average data breach costs $4.35 million as of 2022.
-
88% of professional hackers can infiltrate an organization in only 12 hours
For further analysis, we broke down the data in the following ways:
General | Types | Cost | Victim | Over Time | Location
General Cybercrime Statistics
To address the prevalence of cybercrime, here are some essential and general facts about the current state of the issue:
-
There is a new cybercrime victim once every 37 seconds.
Even if it only took you five minutes to read this article, an estimated eight people will have fallen victim to a cybercrime within that time. Further, threats like ransomware attacks are even more frequent, occurring once every 11 seconds on average.
-
86.2% of organizations have been hit by a successful cyber attack.
Comparably, only 61.9% of organizations were hit by successful cyber attacks in 2014. The share of organizations affected has been growing consistently year-over-year for at least four years now.
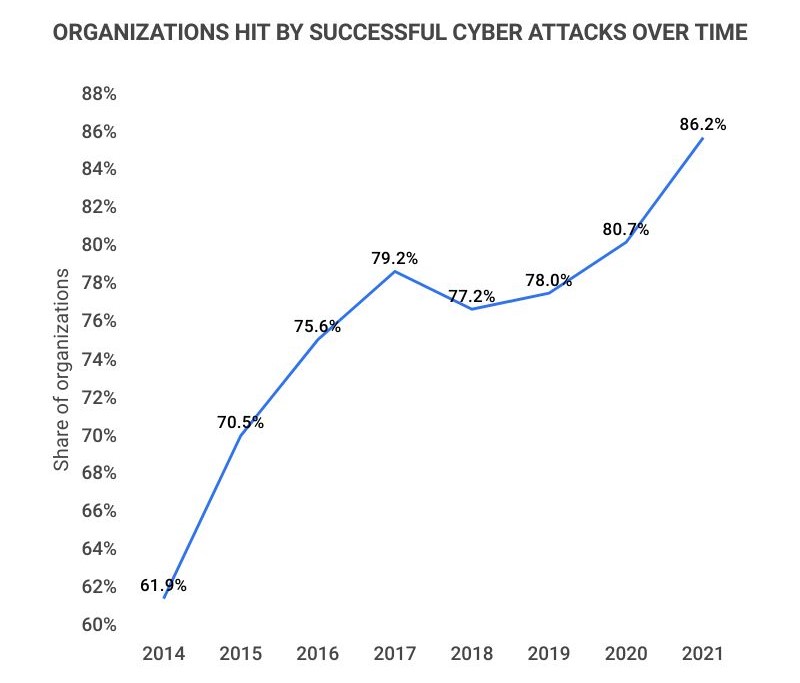
Year Share of organizations hit by a successful cyber attack 2014 61.9% 2015 70.5% 2016 75.6% 2017 79.2% 2018 77.2% 2019 78.0% 2020 80.7% 2021 86.2% -
Cybercrime cost the US $6.9 billion in 2021 alone.
As of 2022, the average cost of a US data breach reached $9.44 million, which is not only more than double the global average but also means that hundreds, if not thousands, of successful data breaches are affecting the US each year.
-
Global cybercrime cost an estimated $8.44 trillion in 2022.
And this number is only expected to grow at a rapid rate, being estimated to reach an unbelievable $23.84 trillion by 2027.
Year Annual cost of cybercrime 2018 $860B 2019 $1.16T 2020 $2.95T 2021 $5.99T 2022 $8.44T 2023* $11.50T 2024* $14.57T 2025* $17.65T 2026* $20.74T 2027* $23.82T -
Global annual spending on cybersecurity reached $150 billion in 2021.
This marked an increase of 12.4% from the year prior and will likely continue to increase as cybercrime grows.
Types of Cybercrime
From malicious emails to sophisticated hacking, cybercrime takes many different forms. Here are some prominent examples of the different types of cybercrime:
-
323,972 US internet users were victims of phishing attacks in 2021.
Believe it or not, 1.5 million new phishing websites are made every single month, making it difficult for US internet users around the world to avoid malicious sites. Other common cybercrimes include non-payment/non-delivery (82,478), personal data breach (51,829), identity theft (51,629), and extortion (39,360).
Type of cybercrime Number of reported crimes (2021) Phishing attacks 323,972 Non-payment/non-delivery 82,478 Personal data breach 51,829 Identity theft 51,629 Extortion 39,360 Confidence/romance fraud 24,299 Tech support 23,903 Investment 20,561 BEC/EAC 19,954 Spoofing 18,522 -
Business email compromises are the most costly form of cybercrime, costing $2.396 billion in 2021.
Others among the top five most costly cybercrimes include: investment ($1.456 billion), confidence/romance fraud ($956 million), personal data breach ($517 million), and real estate/rental ($350 million).
Types of cybercrime Annual cost (2021) Business email compromises $2.396B Investment $1.456B Confidence/romance fraud $956M Personal data breach $517M Real estate/rental $350M Tech support $348M Non-payment/non-delivery $337M Credit card fraud $173M Corporate data breach $152M Government impersonation $143M -
Organized crime accounts for 51% of data breaches
Though organized criminals are only responsible for just over half of data breaches, they account for up to 85% of all stolen data.
The Cost of Cybercrime on Business
The number of victims or money lost can give us an idea of how damaging cybercrime is, but ultimately it’s important to understand just how damaging these attacks are for businesses. These attacks can easily shutter small businesses and bankrupt large companies, which affects the livelihoods of all people involved. Here are the facts:
-
46% of cybercrime breaches impact businesses with less than 1,000 employees.
SMB businesses are especially vulnerable to the effects of cybercrime, and unfortunately, 61% of SMBs were the target of an attack in 2021.
-
60% of small companies close within six months of a cyber attack.
And given the sheer number of SMBs that have been targeted, it’s easy to see just how big of an issue cybercrime has become.
-
The average cost of a company data breach increased by 2.6% between 2021-2022.
The average cost of a data breach in 2022 was $4.35 million, which was up 2.6% from $4.24 million in 2021. Most likely, the cost of data breaches will continue to increase.
-
51% of small businesses have no cybersecurity measures in place.
Despite how detrimental cyber attacks are, 36% of small businesses are “not at all concerned” about them. This partially explains why SMBs are common targets, as hackers are aware of the lack of security.
-
The Cam4 data breach of March 2020 exposed over 10.88 billion data records.
By far the largest data breach in recent memory, other far-reaching and massive breaches that have occurred within the past ten years include:
Data breach Number of exposed records Cam4 (Mar 2020) 10.88B Yahoo (2017) 3.00B Aadhaar (Mar 2018) 1.10B First American Financial Corporation (May 2019) 885M Verifications.io (Feb 2019) 763M LinkedIn (Jun 2021) 700M Facebook (Apr 2019) 533M Yahoo (2014) 500M Satwood (Nov 2018) 500M Adult Friend Finder (Oct 2016) 412M -
It takes an average of 207 days for businesses to identify a data breach.
While the average time to contain the breach is 70 days, meaning that as of 2022, the average data breach lifecycle is 277 days.
Cybercrime Victim Statistics
As well as affecting businesses, cybercrime can have a devastating impact on individual people. To learn more, here are some essential statistics:
-
Identity theft was responsible for $3.3 billion in fraud in 2021.
That was up a significant 83% increase from 2019 when identity theft was responsible for $1.8 billion in fraud.
-
There were 5.7 million identify theft and fraud victims in the US in 2021.
Every year between 7%-10% of US citizens are victims of identity fraud, with 21% of these victims being repeat victims.
-
75% of Americans worry about hackers stealing personal information.
Cybercrime is a huge worry for most Americans. We also worry about identity theft (73%), meaning cybercrime is above concerns like having your car stolen, your home being burglarized, or being mugged.
Cybercrime Over Time
Cybercrime has become an increasingly problematic issue over time, especially after more and more people and businesses moved online in 2020. Consider these facts:
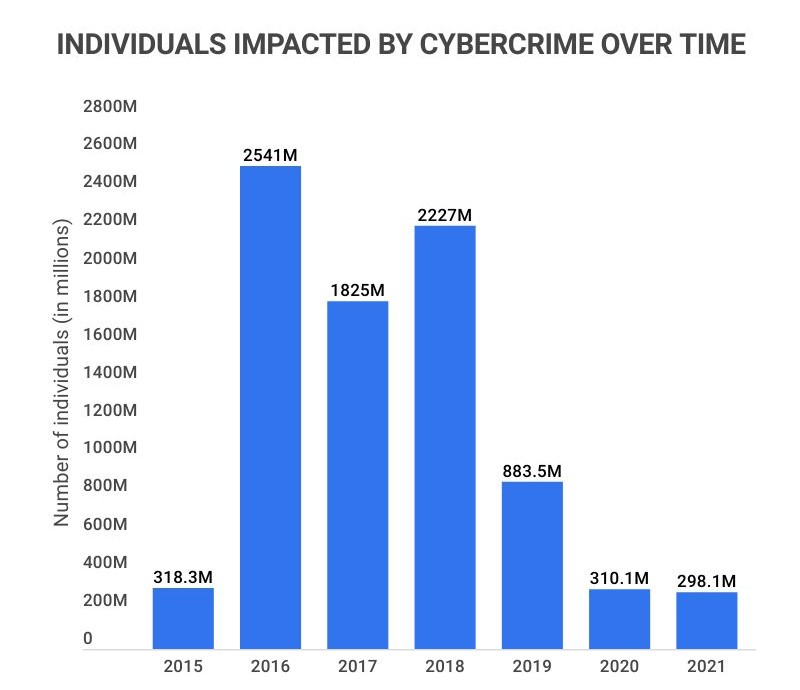
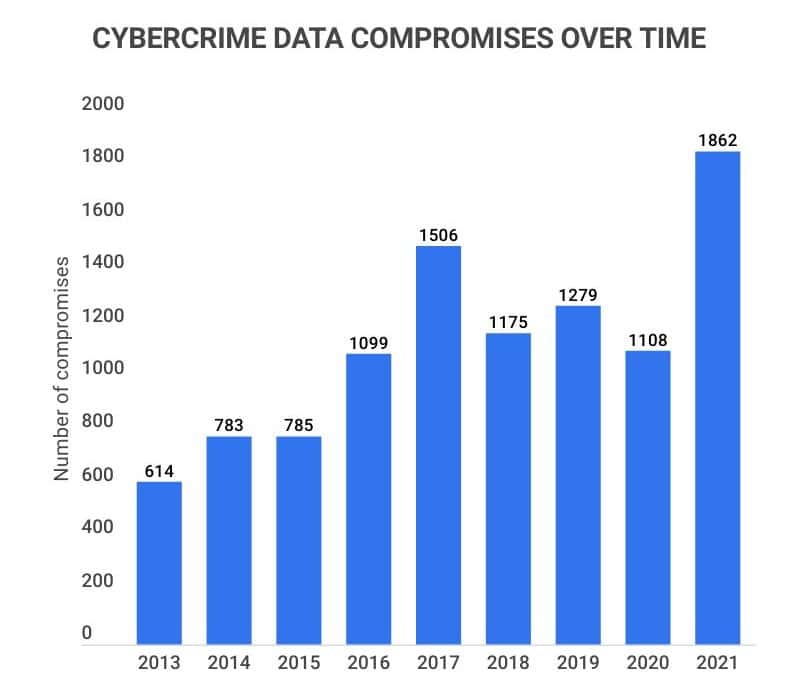
| Year | Data compromises | Number of records exposed | Individuals impacted |
|---|---|---|---|
| 2013 | 614 | 91.98M | |
| 2014 | 783 | 85.61M | |
| 2015 | 785 | 169.10M | 318.28M |
| 2016 | 1,099 | 36.60M | 2.541B |
| 2017 | 1,506 | 198.00M | 1.825B |
| 2018 | 1,175 | 471.23M | 2.227B |
| 2019 | 1,279 | 164.68M | 883.56M |
| 2020 | 1,108 | 310.12M | |
| 2021 | 1,862 | 298.08M |
-
There were 471.23 million records exposed in 2018.
2018 saw more records exposed than any other year. Even though 2017 has the second-highest number of records exposed (198.00M), that’s still only 47% of 2018’s numbers.
-
There were 1,862 data compromises in 2021.
2021 was the worst year for data compromises, being worse than 2017 (1,506) and 2019 (1,279). Meanwhile, the number of data compromises consistently trends downwards when going back in time, as there were only 157 in 2005.
-
2.541 billion individuals were impacted by data breaches in 2016.
Despite only 36.6 million records being exposed in that same year, a truly massive number of people were impacted. Similarly, 2.227 billion people were impacted by data breaches in 2018.
-
Between 2020-2021, ransomware attacks increased by 62%.
Ransomware has experienced a sharp year-over-year increase in recent years, while the average ransomware payment also rose 82% between 2020-2021 as well.
-
An estimated 33 billion records will be stolen by cyber criminals in 2023.
This would be a full 50% increase from the estimated 22 billion records stolen in 2022, evidence that cybercrime is still on the rise.
-
Cybercrime is expected to cost $10.5 trillion annually by 2025.
The cost of cybercrime is projected to grow at a rate of at least 15% per year, which would mark an increase from $3 trillion in 2015 to $10.5 trillion in 2025.
Cybercrime by Location
Cybercrime can also be better or worse depending on which country or state you live in. To learn more about the best and worst places, here are some essential statistics:
-
The UK has the highest cybercrime density, with 4,783 of every 1 million internet users being affected.
Surprisingly, the US isn’t number one on this list. However, the US does take second place, with 1,494 out of every 1 million internet users being affected. Others among the top five include: Canada (174), Australia (102), and Greece (72).
Country Victims/1M internet users (2021) Year-over-year change (2020-2021) United Kingdom 4,783 +40% United States 1,494 -13% Canada 174 +7% Australia 102 -22% Greece 72 -75% South Africa 52 +2% Netherlands 41 +50% France 33 +20% Germany 18 -9% Mexico 16 +14% -
Out of 75 countries, Denmark is the most cyber-safe.
In Denmark, only 1.33% of mobile devices are infected with malware, 3.26% of computers are attacked by phishing, and no one is impacted by mobile banking or ransomware trojans, among other positives. Other countries with high safety ratings include Sweden, Ireland, Norway, and Finland.
-
Nevada has the most cybercrime per capita in the US, at 523 victims per 100,000 people.
Others among the top five worst states for cybercrime include Iowa (297), Alaska (283), Florida (250), and Maryland (245).
-
Mississippi has the least cybercrime per capita in the US, at only 83 victims per 100,000 people.
Others among the top five best states for minimal cybercrime include South Dakota (88), North Dakota (100), West Virginia (106), and Louisiana (109).
State Cybercrime victims/100,000 people (2021) Mississippi 83 South Dakota 88 North Dakota 100 West Virginia 106 Louisiana 109 Nebraska 112 South Carolina 114 Ohio 115 North Carolina 117 Alabama 118
Cybercrime FAQ
-
How many cyber attacks are there per day?
There are over 2,200 cyber attacks per day. This equates to one cyberattack every 39 seconds, meaning that if it took you 10 minutes to read this article, there would be at least 15 cyber attacks within that timeframe.
-
How fast is cybercrime growing?
Cybercrime is growing at an average annual rate of 15% per year. This increase can be measured through many metrics, such as the amount of money lost to cybercrime or the sheer volume of stolen records.
For example, in 2015, cybercrime cost an estimated $3 trillion, but by 2025, it’s predicted to cost as much as $10.5 trillion. Likewise, there were 1,862 data compromises in 2021 and only 157 back in 2005.
-
Where does the US rank in cybersecurity?
The US ranks #31 out of 75 countries in cybersecurity. On this list, Tajikistan has the worst cybersecurity (rank 1), while Denmark has the best (rank 75). Here are the factors that contribute to what rank a country gets:
-
% of mobile devices infected with malware (mobile & non-mobile)
-
% of users attacked by banking or ransomware trojans (mobile & non-mobile)
-
% of computers infected by at least one malware attack
-
% of mobile users attacked via web sources
-
% of telnet and SSH-based attacks by originating country (IoT)
-
% of attacks by cryptominers
-
% of all spam emails by originating country
-
% share of countries targeted by malicious mailings
-
% of computers attacked by phishing
When it comes to these factors, the US is just below average when it comes to cybersecurity. However, it is important to note that the US does experience the 2nd highest number of cyber attack victims per capita, at 1,494 per 1 million internet users.
-
-
Who is the most common victim of cybercrime?
Young women are the most common victims of cybercrime. This is a two-fold answer, as women and young people are more likely to be affected by cybercrime, respectively. For instance, women are 26% more likely to be victims of cybercrime, and 54% of those between 18-24 have experienced cybercrime.
Comparably, 47% of men are victims of cybercrime (while 53% of women are), and only 33% of people 55-64 experience a cybercrime.
-
How often do cybercriminals get caught?
Cybercriminals are not caught often. On average, less than 5% of hackers and other cybercriminals are caught, and only 0.3% of all reported cybercrime complaints are enforced.
There are many issues that come with trying to police cybercrime. For example, it can be difficult to break through anonymity barriers put in place by hackers on the internet, and even if hackers can be identified, they often come from different regions or countries. This then leads to complications with international laws and other issues.
Conclusion
Cybercrime has been on the rise for a while now and is expected to grow at a rate of at least 15% per year. Today, 23% of Americans (nearly one in four) have been victims of cybercrime, and 54% of companies have experienced a cyberattack within the past 12 months.
And these attacks come at an immense cost; $4.35 million per data breach as of 2022. Costly breaches have resulted in 60% of small companies closing within six months of a cyber attack and other detrimental effects on large companies and individual people.
Ultimately, regardless of what country you live in, it’s imperative that you take steps to protect yourself and your business’s data. Whether through the use of password managers or increased cybersecurity measures, don’t wait until it’s too late.
References
-
University of North Georgia – Cybersecurity: A Global Priority and Career Opportunity
-
Security – $4.35 million — The average cost of a data breach
-
Statista – Average cost of a data breach in the United States from 2006 to 2022
-
Cybercrime Magazine – 60 Percent Of Small Companies Close Within 6 Months Of Being Hacked
-
Statista – Number of compromised data records in selected data breaches as of August 2022
-
Cyber Security Hub – The biggest data breaches and leaks of 2022
-
Cybercrime Magazine – Cybercrime To Cost The World $10.5 Trillion Annually By 2025
-
PC – Which Country Has the Most Cybercrime Per Capita? It’s Not the US
-
Comparitech- Which countries have the worst (and best) cybersecurity?
- Tech Industry Statistics
- MFA Statistics
- Streaming Services Statistics
- Mobile Vs. Desktop Usage Statistics
- AI Statistics
- Live Streaming Statistics
- Zoom Meeting Statistics
- Cord Cutting Statistics
- Digital Transformation Statistics
- Virtual Reality Statistics
- How Fast Is Technology Advancing
- Mobile Commerce Statistics
- SaaS Statistics
- Machine Learning Statistics
- Diversity In High Tech
- Cyber Security Statistics
- Ecommerce Statistics
- Tech Industry
- Gaming Industry
- Renewable Energy Job Creation
- Smartphone Industry
- Cybercrime Statistics
- Amazon Statistics
- Personalization Statistics
Author
Jack Flynn is a writer for Zippia. In his professional career he’s written over 100 research papers, articles and blog posts. Some of his most popular published works include his writing about economic terms and research into job classifications. Jack received his BS from Hampshire College.