- Industry Statistics
- Wedding Industry Statistics
- Yoga Industry Statistics
- Music Industry Statistics
- Landscaping Industry Statistics
- Bicycle Industry Statistics
- Coffee Industry Statistics
- Car Rental Industry Statistics
- Home Improvement Industry Statistics
- Insurance Industry Statistics
- Supplements Industry Statistics
- Golf Industry Statistics
- Fitness Industry Statistics
- US Media And Entertainment Industry Statistics
- Firearm Industry Statistics
- Financial Services Industry Statistics
- Health And Wellness Industry Statistics
- Trucking Industry Statistics
- Wine Industry Statistics
- Pet Industry Statistics
- Mobile App Industry Statistics
- Digital Marketing Industry Statistics
- Hotel Industry Statistics
- Retail Statistics
- Robotics Industry Statistics
- Jewelry Industry Statistics
- Appointment Scheduling statistics
- Restaurant Industry Statistics
- Food Delivery Statistics
- Food Truck Industry
- Fashion Industry
- Real Estate Industry
- US Film Industry
- US Beverage Industry
- USu202fFast Food Restaurants
- US Construction Industry
- US Book Industry
- Cosmetics Industry
- US Food Retail Industry
- US Pharmaceutical Industry
- US Healthcare Industry
- Airline Industry
- Automobile Industry
- Transportation Industry Statistics
- Event Industry Statistics
- Project Management Statistics
- Oil And Gas Industry Statistics
- Nursing Home Statistics
- Nursing Shortage Statistics
- Nursing Statistics
Research Summary. The auto industry is one of the most massive operations in the United States. Although the automotive industry took a hit during the pandemic, current trends show that it’s bouncing back unscathed:
-
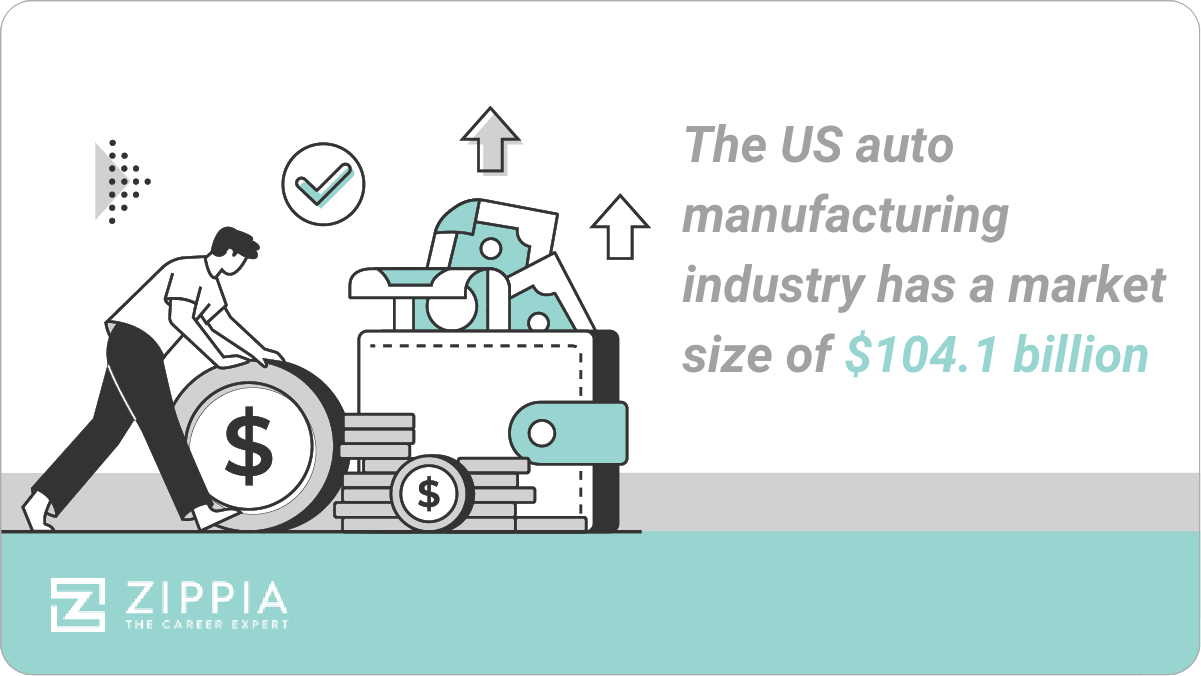
The total value of the US car and automobile manufacturing market is $104.1 billion in 2023
-
9.2 million US vehicles were produced in 2021
-
The US produced 9.2 million vehicles in 2021, a 4.5% increase from 2020
-
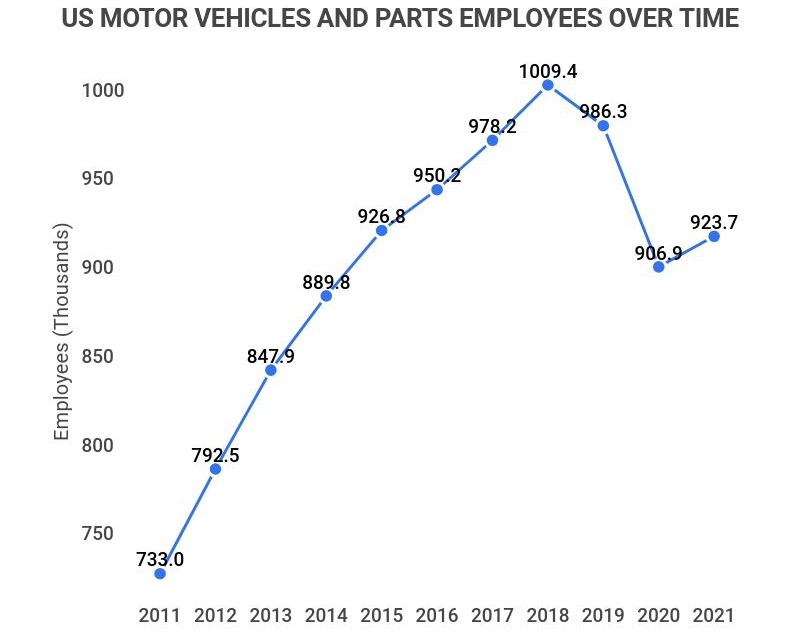
923,000 Americans work in motor vehicles and parts manufacturing, and 1,251,600 are employed by automobile dealers
-
The revenue of United States motor vehicle and parts dealers was $1.53 trillion as of 2021
-
The auto industry accounts for 3% of America’s GDP
-
The US automobile industry sold an estimated 13.75 million cars and light truck vehicles in 2022
For further analysis, we broke down the data in the following ways:
US Economy | Jobs | Trends and Predictions | Pandemic | Environmental Impacts
General Automotive Industry Statistics
-
Over 10.9 million new light trucks and 2.9 million passenger cars were sold in the United States in 2022.
-
There were 36.2 million used light vehicles sold in the United States in 2022.
-
In 2022, Americans bought an approximate total of 13.75 million cars.
-
As of 2020, 91.5% of households report having access to at least one vehicle.
-
There were 290.8 million registered vehicles in the United States in 2022.
-
There are approximately 1.446 billion vehicles registered in the world.
-
Over 77.6 million vehicles were produced globally in 2020. The US ranks only behind China in total vehicle production.
As a whole, Americans spend $698 billion annually on the combination of automobile loans and insurance.
Vehicles Sold by Country 2020
| Country | Cars | Commercial Vehicles | Total | % Y-o-Y Change |
|---|---|---|---|---|
| Global | 55,834,456 | 21,787,126 | 77,621,582 | -16% |
| China | 19,994,081 | 5,231,161 | 25,225,242 | -2% |
| USA | 1,926,795 | 6,895,604 | 8,822,399 | -19% |
| Japan | 6,960,025 | 1,107,532 | 8,067,557 | -17% |
| Germany | 3,515,372 | 227,082 | 3,742,454 | -24% |
| South Korea | 3,211,706 | 295,068 | 3,506,774 | -11% |
The Automotive Industry and The US Economy
-
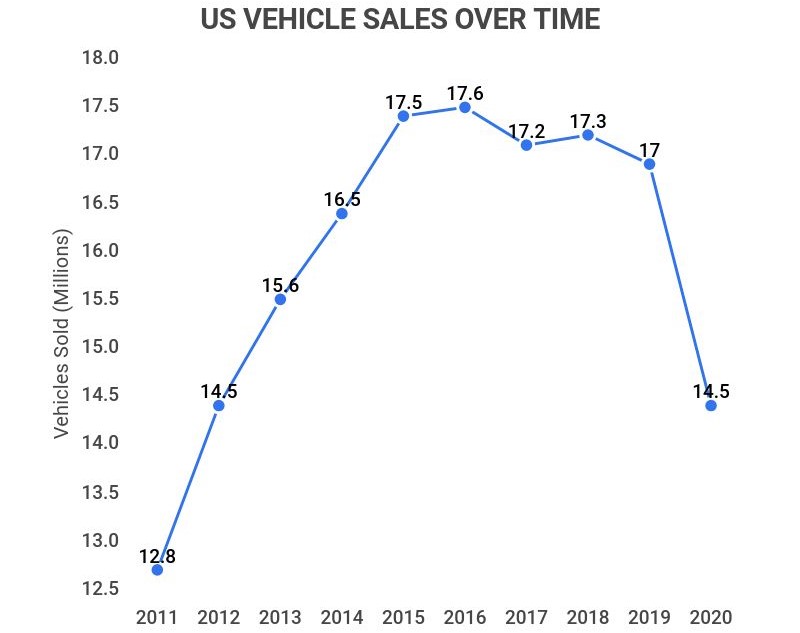
US vehicle sales fell by 8.6% in 2022.
Vehicle sales dropped significantly in 2020, and while 2021 saw a sustainable recovery, sales still declined once again in 2022.
US Vehicle Sales 2011-2022
Year Vehicles Sold (millions) 2011 12.8 2012 14.5 2013 15.6 2014 16.5 2015 17.5 2016 17.6 2017 17.2 2018 17.3 2019 17 2020 14.5 2021 16.3 2022 14.9 -
The United States auto industry represents 3% of the total American GDP.
Additionally, the auto industry is the United State’s largest exporter and generates more jobs than any other field. In the United States, the auto industry is one of the biggest investors in research and development.
-
$114.6 billion in direct foreign investments were put into the United States auto industry in 2018.
In 2018, 1.8 million new light vehicles and 131,200 medium/heavy trucks were exported from the United States. These exports were worth an estimated total of $60 billion.
-
The United States ranked second in the global automotive market with 9.2 million vehicles produced in 2021.
The only country ahead of the United States in terms of vehicle production was China, with a massive production total of over 25 million.
-
An estimated $82 billion was allocated by the United States Department of Treasury to bail out the auto industry.
This was the second-highest amount that was filled out to businesses during government bailouts. The only other industry that surpassed this amount was banking institutions with $250 billion.
-
The top three automobile manufacturers in the United States are General Motors Company (GM), Fiat Chrysler Automobiles (FCAU), and Ford Motor Company (F).
While there are other major vehicle manufacturers in the United States, these three are consistently dominating the auto market. Today, their biggest competition is foreign auto manufacturers from Europe, Japan, and South Korea like Toyota, Hyundai, and Honda.
-
US vehicle production has fallen by 27.7% since 2016.
Down from over 12 million vehicles produced in 2016, America’s annual car production of 8.8+ million vehicles in 2020 represents a significant decline.
In 2021, around 1.6 million passenger cars and light vehicles were exported from the United States.
The number of vehicle exports from the United States increased by 14.3%. Canada imported the most US passengers vehicles in 2021.
US Vehicle Production 2016-2020
| Year | Vehicles Produced |
|---|---|
| 2016 | 12.2M |
| 2017 | 11.2M |
| 2018 | 11.3M |
| 2019 | 10.9M |
| 2020 | 8.8M |
| 2021 | 9.2M |
Automotive Industry Jobs Statistics
-
The automobile industry employs over 1.7 million people in total.
Jobs in the auto industry can focus on aspects like engineering, manufacturing, sales, and design.
-
As of November 2021, 923,700 people are working in motor vehicles and parts manufacturing jobs in the United States.
This amount of employees working in auto manufacturing has risen from 906,900 in the previous year. That’s an increase of 16,800 positions in employment — a good start to an industry recovery from the pandemic.
-
Around 2 million people work in auto sales jobs in the United States.
Auto sales jobs make up around 1.25% of all employed Americans. That might not seem like a lot, but it’s a very significant number given the number of different career paths in the US.
-
As of November 2021, 1,251,600 people are working at automobile dealerships.
The number of people working at automobile dealerships has risen by 21,900 people from 1,229,700 since last year.
-
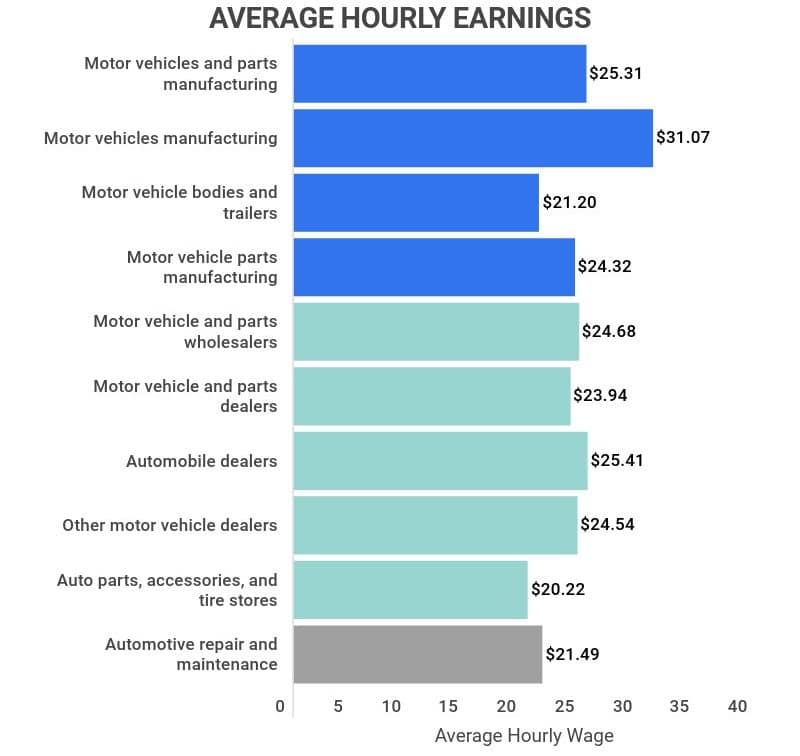
The average hourly pay of an automobile dealership employee is $25.76 as of March 2023.
The average hourly pay of employees at auto dealerships has increased by $0.35 per hour (1.4%) since 2021, when the annual average was $25.41.
Automotive Industry Trends and Predictions
-
The automobile industry in the United States has routinely fluctuated between 10 million cars sold to 17 million cars sold since 1976.
The economic recession of 2008 brought about some of the lowest rates of vehicle buying since the eighties. Since then, the amount of cars sold in the United States auto industry has slowly risen by 60% between 2009 and 2018.
-
The United States auto industry spends approximately $18 billion per year on research and development (RD).
Despite being the highest contributor to greenhouse gas emissions, the automotive industry accounts for the smallest percentage of global RD spending at 16%. Healthcare, electronics, and other industries all spend more on research and development. In the auto industry, the biggest contributors to RD as of 2013 were Volkswagen, Toyota, General Motors, Honda, and Daimler.
-
The automotive market in North America is predicted to expand at a compound annual growth rate (CAGR) of around 7.22%.
With this growth comes more of a focus on producing electric vehicles to meet the increasing demand and adhere to the guidelines for emission standards. The key trends predicted to occur in coming years are an increase in the number of electric vehicles sold and a more competitive market beyond the three biggest American auto manufacturers.
Automotive Industry Statistics in the Pandemic
-
Between 2019 and 2020, the total number of vehicles sold dropped by approximately 13.3%.
In 2019, there were approximately 16,961,000 sales of light vehicles in the United States. This number dropped enormously to 14,471,800 retail vehicle sales.
-
According to Kelly Blue Book, the average price for a new car has reached $38,723 as of September 2020.
This is a price increase of 2.5% from the previous year. For the past 20 years, the cost of buying a new car has steadily been climbing from $21,850. That’s a price increase of over 56% since 2000.
-
The price of used cars increased by 17% between 2020 and 2021.
The average price of a used car in 2020 was $23,371. This average price of a used car made an enormous leap to $27,297 in April of 2021. Within only a year, the price of a used car rose by nearly $4,000.
This is a huge fluctuation compared to the price change between 2019 to 2020, when the cost of a used car declined by 0.2%.
-
Due to limited vehicle transportation during the COVID-19 pandemic, the United States decreased its emissions by 13% in 2020.
However, this drop in emissions that occurred immediately after lockdowns began to quickly bounce back once the economy started turning around and regulations were lifted.
-
The National Highway Traffic Safety Administration reported that an estimated 38,680 people died in motor vehicle accidents in 2020.
The administration reported a decrease of 13.2% or 430.2 billion miles in the number of miles traveled by vehicles in the United States. However, despite there being much less traffic on the road in 2020, there was still an increase of 7.2% in motor vehicle and traffic deaths from 2019.
Environmental Impacts of the Automotive Industry
-
29% of greenhouse gas (GHG) emissions in the United States came from transportation in 2019
-
58% of greenhouse gas (GHG) emissions from the United States transportation sector came from light-duty vehicles or passenger vehicles
-
While the world’s energy emissions fell by a record-breaking 7% in 2020, the emissions from SUVs have increased by 0.5%, and oil consumption from SUVs soared to 5.5 million barrels per day
-
The oil use in all cars other than SUVs has decreased by 10% or 1.8 million barrels per day in 2020, likely due to the impacts of COVID-19
-
From 2014 to 2019, Kia models achieved the largest reduction in their CO2 emission rates at 31 gallons per mile.
Automotive Industry FAQ
-
How much is the automobile industry worth?
The US automobile industry is worth $104.1 billion in 2023. That’s a 26% increase in worth from 2021, when the industry was valued at $82.6 billion.
-
What percentage of the economy is the auto industry?
America’s auto industry accounts for 3% of the United States GDP. Despite the Pandemic, the US automotive industry is still America’s largest manufacturing sector, and contributes a sizable amount to the national economy.
-
Is the automotive industry the biggest industry?
No, the automotive industry is not the biggest industry in the United States. The biggest industry is real estate, renting, and leasing. Auto manufacturing does make up a significant portion of America’s durable manufacturing industry, which ranks as the fifth-biggest in the nation.
-
Is the automobile industry growing?
Yes, the US automobile industry is growing at a compound annual growth rate of 7.22%. Though the industry did take a hit in 2020, it has since began to recover.
-
How many jobs are available in auto manufacturing?
The US automotive industry supports over 7.25 million jobs. These available jobs can range from work in research labs and supplier factories, to assembly lines and dealership showrooms.
Conclusion
Americans depend on their 290.8 million registered vehicles to transport them across the roads, which is why the automotive industry is so incredibly profitable. The automotive field has been fluctuating in its sales numbers for about the past 50 years, but in general, vehicle manufacturers in the United States are still one of the largest industries out there.
Most recently in 2022, the automobile industry is still on shaky ground as it recovers from the uncertain circumstances of 2020, which caused a lack of consumer demand for new vehicles. 14.5 million cars and light trucks were sold in the United States in 2020, representing a decrease of 13.3% from the previous year. And this decline has only been exacerbated in 2022, with roughly 13.75 million light cars and trucks being sold.
While the auto industry is unequivocally profitable, its products are responsible for an enormous amount of the dangerous emissions contributing to global warming. According to the United States Environmental Protection Agency, most greenhouse gas emissions come from transportation 29%.
Of these emissions, 58% originated from light-duty vehicles, also known as the passenger vehicles that most people own. This is more than the greenhouse emissions from medium/heavy-duty trucks, aircraft, trains, boats, and any other method of transportation combined.
References
-
Statista. “Vehicle sales in the United States 1976-2020.” Accessed on August 18, 2021
-
Doxo.“Cost of Car Ownership in the US: Auto Insurance and Auto Loans Reports 2021.” Accessed on August 18, 2021
-
Ibisworld. “Car Automobile Manufacturing in the US – Market Size 2005–2027.” Accessed on August 18, 2021
-
CarProUSA. “NADA First Quarter 2021 Auto Industry Analysis.”
-
Statistica. “US motor vehicle and parts retail trade revenue 2000-2020.” Accessed on August 18, 2021
-
Statistica. “US new and used car sales 2010-2020.” Accessed on August 18, 2021
-
Value Penguin. “Car Ownership Statistics (2021 Report).” Accessed on August 18, 2021
-
Hedges Company. “US VEHICLE REGISTRATION STATISTICS.” Accessed on August 18, 2021
-
Hedges Company. “How Many Cars Are There in the World in 2021?” Accessed on August 18, 2021
-
Experian. “What Is the Average Price for a New Car?” Accessed on August 18, 2021
-
Silive. “Used car prices on the rise, but how steep is the increase in NYC?” Accessed on August 18, 2021
-
Nature. “COVID curbed carbon emissions in 2020 — but not by much.” Accessed on August 18, 2021
-
U.S. News World Report. “Traffic Deaths Increased in 2020 Despite Fewer People on Roads During Pandemic.” Accessed on August 18, 2021
-
Statistica. “Vehicle sales in the United States 1976-2020.” Accessed on August 18, 2021
-
CarGroup. “Just How High-Tech is the Automotive Industry?” Accessed on August 18, 2021
-
Business Wire. “North American Automotive Market Report 2020-2025 – ResearchAndMarkets.com” Accessed on August 18, 2021
-
Forbes. “U.S. Vehicle Exports, Imports Sink to 18-Year Low, New Data Shows.” Accessed on August 18, 2021
-
Statistica. “U.S. light vehicle export volume 2014-2020.” Accessed on August 18, 2021
-
American Auto Makers. “US Economic Contributions.” Accessed on August 18, 2021
-
SelectUSA. “AUTOMOTIVE SPOTLIGHT: The Automotive Industry in the United States.” Accessed on August 18, 2021
-
The Global Economy. “Passenger car sales – Country rankings.” Accessed on August 18, 2021
-
Wikipedia. “List of countries by motor vehicle production.” Accessed on August 18, 2021
-
U.S. Department of the Treasury. “Troubled Assets Relief Program (TARP).” Accessed on August 18, 2021
-
Investopedia. “Big Three Automakers.” Accessed on August 18, 2021
-
CarGroup. “Contribution of the Automotive Industry to the Economies of all Fifty State and the United States.” Accessed on August 18, 2021
-
U.S. Bureau of Labor Statistics. “Automotive Industry: Employment, Earnings, and Hours.” Accessed on August 18, 2021
-
IEA. “Carbon emissions fell across all sectors in 2020 except for one – SUVs.” Accessed on August 18, 2021
-
EPA. “Highlights of the Automotive Trends Report.” Accessed on August 18, 2021
-
EPA. “Fast Facts on Transportation Greenhouse Gas Emissions.” Accessed on August 18, 2021
-
Statista. Automotive Industry in the United States. Accessed on December 8, 2021
-
OICA. 2020 Production Statistics. Accessed on December 8, 2021
- Industry Statistics
- Wedding Industry Statistics
- Yoga Industry Statistics
- Music Industry Statistics
- Landscaping Industry Statistics
- Bicycle Industry Statistics
- Coffee Industry Statistics
- Car Rental Industry Statistics
- Home Improvement Industry Statistics
- Insurance Industry Statistics
- Supplements Industry Statistics
- Golf Industry Statistics
- Fitness Industry Statistics
- US Media And Entertainment Industry Statistics
- Firearm Industry Statistics
- Financial Services Industry Statistics
- Health And Wellness Industry Statistics
- Trucking Industry Statistics
- Wine Industry Statistics
- Pet Industry Statistics
- Mobile App Industry Statistics
- Digital Marketing Industry Statistics
- Hotel Industry Statistics
- Retail Statistics
- Robotics Industry Statistics
- Jewelry Industry Statistics
- Appointment Scheduling statistics
- Restaurant Industry Statistics
- Food Delivery Statistics
- Food Truck Industry
- Fashion Industry
- Real Estate Industry
- US Film Industry
- US Beverage Industry
- USu202fFast Food Restaurants
- US Construction Industry
- US Book Industry
- Cosmetics Industry
- US Food Retail Industry
- US Pharmaceutical Industry
- US Healthcare Industry
- Airline Industry
- Automobile Industry
- Transportation Industry Statistics
- Event Industry Statistics
- Project Management Statistics
- Oil And Gas Industry Statistics
- Nursing Home Statistics
- Nursing Shortage Statistics
- Nursing Statistics
Author
Sky Ariella is a professional freelance writer, originally from New York. She has been featured on websites and online magazines covering topics in career, travel, and lifestyle. She received her BA in psychology from Hunter College.