Find a Job You Really Want In

Income inequality has been in the news ever since the start of the 99% percent movement in late 2011. With demonstrations like Occupy Wall Street, they have brought visibility to the impact increasing income inequality has had on America over the course of the last 50 years.
But with all the attention paid to income inequality, has anything changed?
According to the recently released American Community Survey data, not really. Income inequality has been increasing in all 50 states from 2010 to 2016 despite some people’s best efforts to stop it.
We broke down the American Community Survey data in detail to see geographical trends in the data over the past 7 years of available data. Here’s what we found.
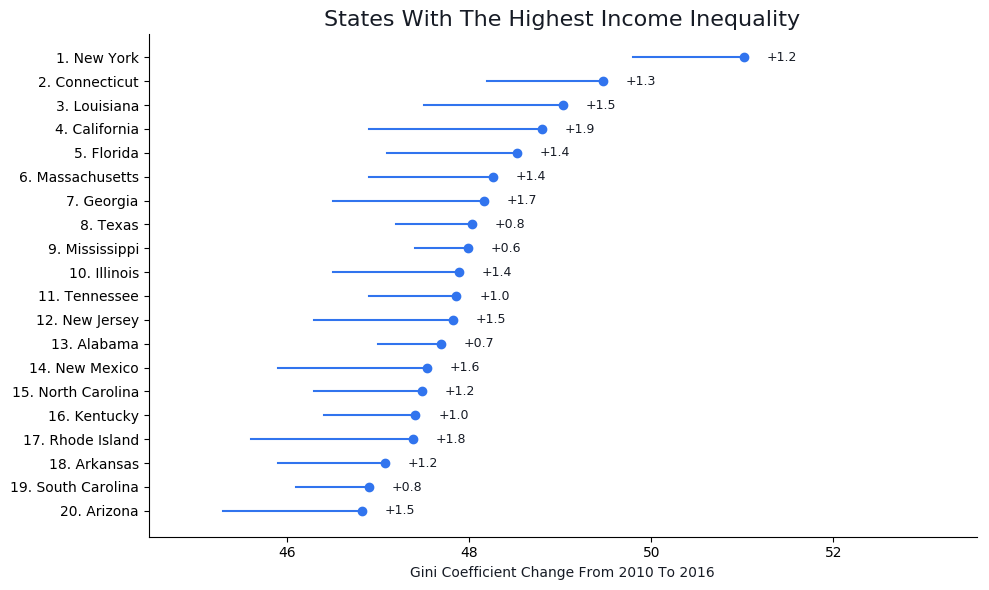
Summary Of Findings
- Income inequality increased in all 50 states from 2010 through 2016
- New York has the highest level of income inequality in both time periods
- Alaska has the lowest levels of income inequality in both time periods
- Income inequality increased the fastest in Montana on both a point change and percent basis (2.17 points and 4.97% respectively)
- Inequality increased the slowest in Wyoming on both a point change and percent basis (.29 points and .68% respectively)
- The rate of inequality growth was 7.5x higher in Montana than Wyoming
- There doesn’t seem to be any obvious geographic consistency to how income inequality changed during this time period — it just increased all over the map
Some details on methodology
For this analysis, we went to the the American Community Survey five year datasets ending in 2010 and 2016.
We then analyzed the Gini coefficient for each state in both time periods. You can read that link for a detailed explanation of the Gini coefficient, but at a high level it is a normalized measure of inequality. Note that we scaled it by 100 for readability.

For a bit of color around how the states compare, we can compare the US and US States to the rest of the world:
- Lesotho (63) is the most unequal in the world.
- New York (51) is about as unequal as Paraguay.
- The US (45) is about as unequal as Peru which is the top third globally
- Alaska (41) is about as unequal as Russia.
- Finland (21.5) is the least unequal in the world.
And here’s a different way to look at the data for the states:
States With Fastest Growing Income Inequality

And here’s a different way to look at the data:

Now Try Zippia’s Job Search
Author
Chris Kolmar is a co-founder of Zippia and the editor-in-chief of the Zippia career advice blog. He has hired over 50 people in his career, been hired five times, and wants to help you land your next job. His research has been featured on the New York Times, Thrillist, VOX, The Atlantic, and a host of local news. More recently, he's been quoted on USA Today, BusinessInsider, and CNBC.