- Workplace Statistics
- Time Management Statistics
- Employee Wellness Statistics
- Employment Discrimination Statistics
- Employee Recognition Statistics
- Employee Referral Statistics
- Workplace Violence Statistics
- Gamification Statistics
- Employee Feedback Statistics
- Agile Statistics
- Productivity Statistics
- Meeting Statistics
- Cell Phones At Work Statistics
- Social Media At Work Statistics
- Workplace Injury Statistics
- Workplace Stress Statistics
- Leadership Statistics
- Workplace Collaboration Statistics
- Job Satisfaction Statistics
- Paid Holiday Statistics
- Communication In The Workplace Statistics
- Wasting Time At Work Statistics
- 4-day Workweek Statistics
Meeting Research Summary for 2026. Meetings remain a staple in the work routine for many professionals. However, without a clear agenda, these gatherings can often detract from productivity. Our updated research highlights the following key insights:
-
In the United States, approximately 55 million meetings are conducted each week, translating to at least 11 million daily and over 1 billion annually.
-
On average, employees spend 3 hours per week in meetings, with 30% reporting they dedicate over 5 hours weekly.
-
Organizations allocate about 15% of their work time to meetings, yet surveys indicate that 71% of these are deemed unproductive.
-
Annually, an estimated $37 billion is lost due to ineffective meetings.
-
Employees waste an average of 31 hours monthly in unproductive meetings.
For a deeper dive, we categorized our findings as follows:
Employee Opinions | Job Level | Virtual vs. In-Person | Unproductive Meetings | Trends
General Statistics on Meetings
Meetings occupy a significant portion of the workday, and our research uncovers essential truths about their impact on productivity. Here are some critical insights:
-
24 billion hours are lost each year due to unproductive meetings.
Approximately 37% of employees view unproductive meetings as the greatest expense to their organization, highlighting the substantial amount of productive time squandered.
-
The average corporate employee spends four hours weekly preparing for and attending meetings.
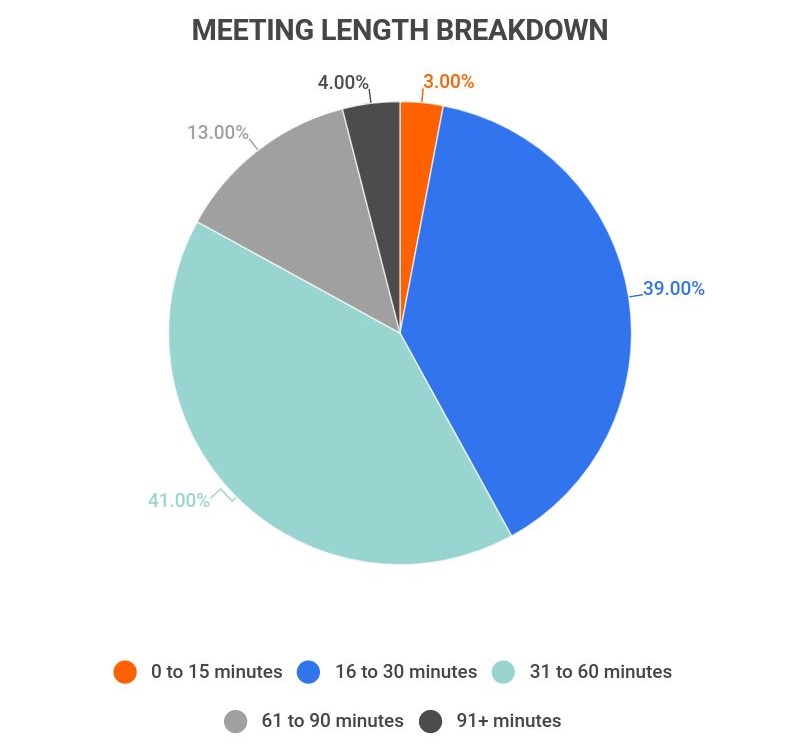
A notable 58% of employees indicate their meetings exceed 30 minutes, and 35% believe they waste two to five hours per week on unproductive meetings.
-
Employees participate in at least eight meetings weekly.
This frequency increases with job rank; executives often attend around 12 meetings each week.

Meeting Statistics by Employee Opinions
While meetings are part of corporate life, employee sentiments often lean negative. Here are some insights:
-
65% of employees feel meetings hinder their ability to complete work.
This sentiment is echoed by surveys indicating that senior employees can spend up to 50% of their work time in meetings.
-
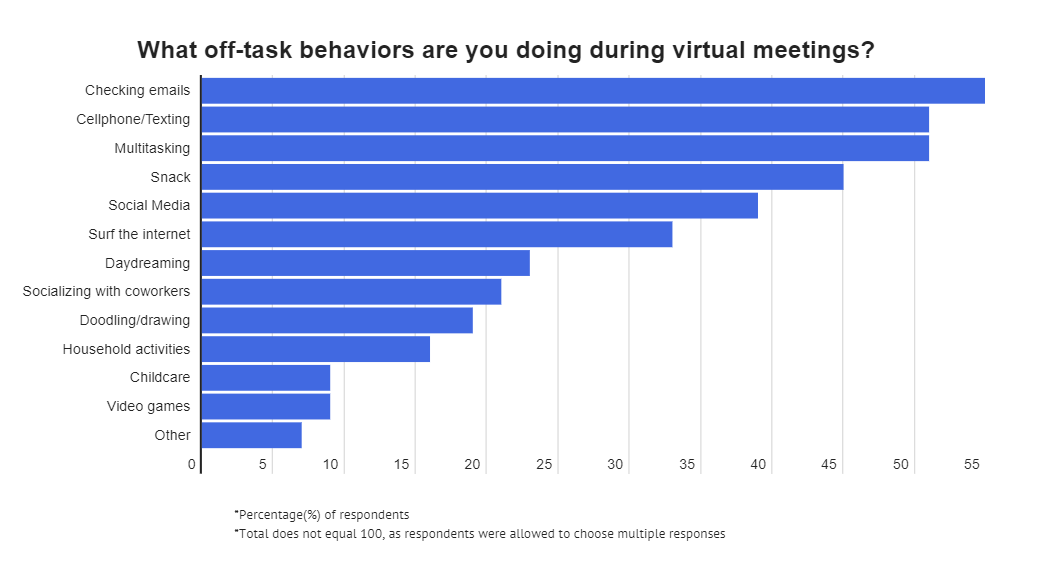
Employees engage in multitasking during 41% of meetings.
Notably, 55% of employees check their emails during meetings, with this behavior more prevalent in longer sessions.
-
45% of employees feel overwhelmed by the volume of meetings.
To mitigate this, limiting attendance to five to eight relevant participants can enhance focus and ensure contributions are meaningful.
-
39% of employees admit to having dozed off during meetings.
Furthermore, an astounding 91% of employees confess to daydreaming during work meetings.
Meeting Statistics by Job Level
Not all job titles are equal when it comes to meeting frequency. Higher-ranking employees typically spend more time in meetings. Here are the facts:
-
The average CEO attends at least 37 meetings weekly, accounting for 72% of their work time.
Middle management allocates about 35% of their time to meetings, while upper management dedicates 50%.
-
35% of employees spend two to five hours daily managing meetings and calls.
Most employees (54%) spend over 30 minutes per meeting, significantly impacting their daily schedules.
-
Office roles see the highest meeting frequency, with VPs and CEOs averaging 12 to 17 meetings weekly.
This figure represents a 53% increase compared to the average employee’s eight meetings weekly.
Virtual vs. In-Person Meeting Statistics
With remote work becoming the norm, the landscape of meetings has shifted dramatically. Here are our findings:
-
Half of remote employees are engaged in one to three hours of virtual meetings weekly.
This is lower than in-person meeting averages, yet many remote workers express frustration over time lost to tech issues, with just under 50% citing this as a concern.
-
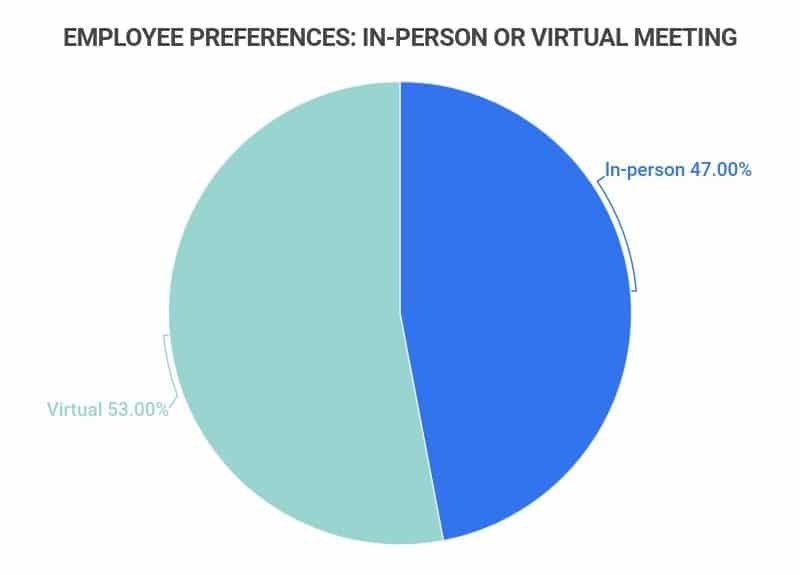
47% of employees prefer in-person meetings.
This preference is underscored by the fact that 90% of Americans desire fewer meetings overall.
-
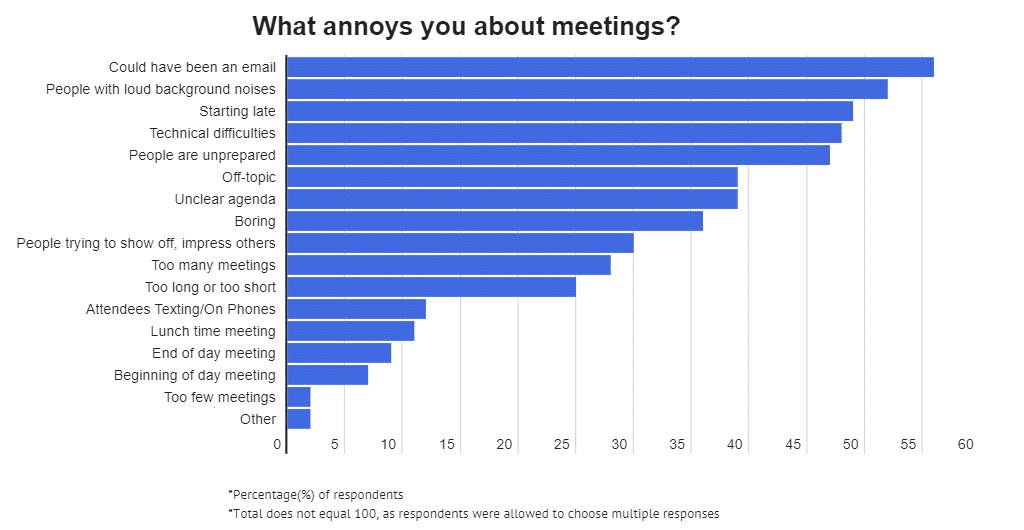
Over 55% of remote workers believe most meetings “could have been an email.”
This frustration is compounded by issues like loud backgrounds and unprepared attendees.
-
15% of remote workers admit to doing household chores during online meetings.
Other common distractions include childcare and pet care, though these behaviors are less prevalent.
-
The number of unique global visitors to Zoom saw fluctuations, peaking at 1.8 million in early 2022 before declining.
This decline followed a period of rapid growth in usage during the pandemic.
-
42% of Zoom users have attended virtual meetings from their beds.
Additionally, 21% engage in meetings while walking or jogging, and 11% do so on public transport. Here are some statistics related to Zoom usage:
Zoom Meeting Statistics
Zoom Meeting Variable Percentage of Zoom Users Wave at the End of a Zoom Meeting 75% Have Said, “You’re on Mute” 71% Dress Casually for Zoom Meetings 68% Say It’s Never Okay to Eat During a Meeting 47% Attend Meetings From Bed 42% Don’t Shower Before Meetings 26% Attend Meetings While Walking or Jogging 21% Attend Meetings While on Public Transportation 11%
Meetings Statistics by Unproductive Meetings
The landscape for workplace meetings is concerning, especially regarding their financial impact. Here’s what we uncovered:
-
U.S. businesses waste a staggering $37 billion each year on unnecessary meetings.
This loss equates to approximately 300,000 hours of work annually, with some large corporations losing up to $300 million on ineffective meetings.
-
30% of workers feel their contributions are dismissed too quickly in meetings.
This can severely affect morale, particularly when valuable ideas go unheard.
-
Only 37% of meetings utilize an agenda.
Agenda-setting is critical for keeping discussions focused and brief.
-
Employees often spend as much time preparing for meetings as they do in them.
This means for every 30 minutes spent in a meeting, there’s an equal amount of time spent preparing.
Meeting Trends and Projections
What does the future hold for workplace meetings? While digital formats have surged, many still prefer in-person interactions. Our findings indicate:
-
From 2020 to 2021, the number of meetings increased by 12.9%.
This growth is largely attributed to the rise of online meetings, even though the duration of meetings has not necessarily lengthened.
-
The average meeting length has decreased by 20.1%.
In 2021, this translated to an 11.5% reduction in daily meeting time.
-
Since 2020, meeting attendance has increased by 13.5%.
This raises concerns, as the optimal number of participants per meeting is ideally five to eight.
-
The global video conferencing market is projected to grow at a CAGR of 11.45% from 2020 to 2026.
From 2019 to 2021, its value surged from $3.85 billion to $6.03 billion, reflecting a 36% increase.
Meeting Statistics by Pre- and Post-Lockdown
| Variable | Pre-Lockdown Average | Post-Lockdown Average |
|---|---|---|
| Total Meeting Hours | 2.7 hours | 2.5 hours |
| Meeting Count | 5.9 meetings | 6.9 meetings |
| Meeting Attendance | 15.6 attendees | 17.7 attendees |
| Single Meeting Length | 1 hour | 0.8 hours |
Meeting Statistics FAQ
-
What percentage of meetings are productive?
Only 11% of meetings are deemed productive. Despite organizations dedicating roughly 15% of their time to meetings, the majority (71%) are considered ineffective.
-
What percentage of time is spent in meetings?
About 6% of work time is spent in meetings — 2.5 meeting hours per week divided by a 40-hour workweek. However, this varies significantly based on role; CEOs can spend up to 72% of their time in meetings.
Overall, corporate roles at higher levels require significantly more meeting time, with middle management spending around 35% and upper management 50% of their time in meetings.
-
What is the average number of meetings in a week?
The average white-collar employee participates in at least eight meetings per week. This number can rise to as high as 17 for VPs, Executives, and CEOs.
-
What is the ideal meeting length?
The ideal meeting length is about 15 minutes. Research indicates that 91% of attendees remain engaged in meetings under this duration, while attention drops to 64% in meetings lasting over 45 minutes.
-
How do you improve work meetings?
Improving meetings involves identifying the purpose in advance, preparing and sharing an agenda beforehand, and capping attendees at 10 maximum. As Amazon CEO Jeff Bezos suggests, “if you need more than two pizzas to feed everyone, there are too many attendees.”
If you’re not leading the meeting, ensure you understand the agenda, contribute meaningfully, and actively listen to your colleagues to foster collaboration and engagement.
Elon Musk also advises that employees should “walk out of a meeting or drop off a call as soon as it is clear they are not adding value — it is not rude to leave, it’s rude to make someone stay and waste their time.” Whether this approach is viable in your workplace may vary.
-
What are the types of meetings?
Meetings can be categorized as status updates, information sharing, decision-making, problem-solving, team-building, and innovation. Specific roles may emphasize certain types; for example, a software engineer may focus more on problem-solving, while executives or managers may prioritize decision-making and status updates.
Conclusion
The current state of meetings is not benefiting American workers. A notable 65% of employees believe meetings impede their productivity, and 45% feel overwhelmed by the sheer number of meetings they attend.
This is alarming given the staggering 55 million meetings occurring weekly in the U.S., with organizations dedicating 15% of their time to them. However, 71% of these meetings are viewed as unproductive, resulting in a loss of $37 billion annually.
Clearly, reform is necessary. Statistics suggest that shorter meetings with fewer participants could be a promising starting point, enhancing engagement and overall productivity.
References
-
Attentiv. “America Meets a Lot. An Analysis of Meeting Length, Frequency, and Cost.” Accessed on September 19th, 2021.
-
Doodle. “The State of Meetings 2019.” Accessed on September 19th, 2021.
-
BOOQED. “Minutes (Wasted) of Meeting: 50 Shocking Meeting Statistics.” Accessed on September 19th, 2021.
-
Harvard Business Review. “Stop the Meeting Madness.” Accessed on September 20th, 2021.
-
Zippia. “Virtual and Zoom Meeting Distraction Statistics [Survey].” Accessed on September 20th, 2021.
-
Atlassian. “You Waste a Lot of Time at Work.” Accessed on September 20th, 2021.
-
The Muse. “How Much Time Do We Spend in Meetings? (Hint: It’s Scary).” Accessed on September 20th, 2021.
-
Jell. “The Financial Value of Productive Meetings.” Accessed on September 20th, 2021.
-
Ragan. “Survey: Jargon, ‘pointless’ meetings hurt morale, productivity.” Accessed on September 20th, 2021.
-
Cornerstone Dynamics. “Meeting Stats That May Surprise You.” Accessed on September 20th, 2021.
-
Avoma. “The Time Spent on Managing (Not Attending) Meetings is More Than 15%.” Accessed on September 20th, 2021.
-
NBER. “Collaborating During Coronavirus: The Impact of COVID-19 on the Nature of Work.” Accessed on September 20th, 2021.
-
Grand View Research. “Video Conferencing Market Worth $9.95 Billion By 2028 | CAGR: 11.4%.” Accessed on September 20th, 2021.
-
Statista. “Worldwide Visits to Zoom.us From December 2021 to May 2022.” Accessed on February 14, 2023.
-
Zoom Blog. “Here’s How You Zoomed Over the Past Year.” Accessed on February 14, 2023.
- Workplace Statistics
- Time Management Statistics
- Employee Wellness Statistics
- Employment Discrimination Statistics
- Employee Recognition Statistics
- Employee Referral Statistics
- Workplace Violence Statistics
- Gamification Statistics
- Employee Feedback Statistics
- Agile Statistics
- Productivity Statistics
- Meeting Statistics
- Cell Phones At Work Statistics
- Social Media At Work Statistics
- Workplace Injury Statistics
- Workplace Stress Statistics
- Leadership Statistics
- Workplace Collaboration Statistics
- Job Satisfaction Statistics
- Paid Holiday Statistics
- Communication In The Workplace Statistics
- Wasting Time At Work Statistics
- 4-day Workweek Statistics
Author
Jack Flynn is a writer for Zippia. In his professional career he’s written over 100 research papers, articles and blog posts. Some of his most popular published works include his writing about economic terms and research into job classifications. Jack received his BS from Hampshire College.